Don’t risk your entire retirement on a hunch.

Here is a cautionary tale of why you should be careful when trying to out fox the stock market. Last week, many people risked their life savings betting everything that Rite-Aid’s stock would shoot up from $3.50 all the way up to the $6.50 / share that Walgreens was offering. If the merger were to happen Walgreens would pay the $6.50 for every share of Rite-Aid stock–nearly a 100% gain. People were betting that the Republican-led FTC would approve the merger, and allow the 2 companies to create the nation’s largest drugstore chain.    Don’t let your greed blind you though. There was a reason that Rite-Aid’s stock was so far below the offer price–the deal was unlikely to pass the regulators.

Turns out Walgreens decided to pull out of the deal last Thursday, and Rite-Aid stock has since dropped to $2.50.   Here are 2 Wall street better’s who went all in.

“The Insider”

This gentleman is a part-time pharmacist at Rite Aid. The internal emails that he received gave him confidence to make a bet on the merger going thru. This probably was not a great decision, since any information disclosed to the front-line workers on the merger were probably also released to the general public via the FTC, SEC or their investor relations website. The stock market reacted to all that information by valuing Rite-Aid far far below the offer price.

He made a nearly $200,000 bet on this. From his original purchase price of $3.20 he has lost nearly 22% in the past week.

Thankfully, he’s a pharmacist so he’ll probably survive despite this bad move.

The $125k YOLO

He bet $125,000 on a hunch at $3.83 / share. With the current share price of $2.50, he has lost over one third of his investment. That equals $42,000, more than the annual incomes of many Americans.


Both of these investors made posts regretting their decisions. I think that it’s important to remember that if something seems too good to be true, it’s probably going to screw you over so be careful. These 2 investors purchased shares with no options to buffer their potential losses. If you’re going to make a life changing decision like betting hundreds of thousands of dollars on a single stock trade, you should probably try to cover your self with some kind of downside protection like a professional investor would.

Net worth of the middle class from 1992 – 2013

One recurring request for the net worth percentile calculator on this website to show a break down of what makes up that net worth value. Here it is for a typical middle class household!

Here are the results of that request for a typical middle class household with comparisons for the past 20 years.  The overall trend for the shows that net worth has increased slightly, but assets and debts have also increased at almost the same rate.

Housing is by far the largest contributor to middle class wealth with investments contributing a far lower amount. In 2013, real estate contributed 54% of net worth ($110k in real estate assets – $64k in real estate related loans).

Net worth peaked in 2007 prior to the recession, and as of 2013 has not recovered yet. The 2016 data should be available over the summer in a few months, so we’ll see if the downward trend continues.

Net Worth Component Definitions

  • Real Estate : House(s) and other real estate
  • Investments : Retirement funds, stocks, mutual funds, stock options
  • Low Risk Investments : Cash, bonds, CD’s, and cash value of life insurance
  • Other Assets : Cars and other assets
  • Real Estate Debt : Mortgages and other real estate related loans
  • Student Loans and Auto Loans : These were already combined in the source data as installment loans.
  • Credit Cards and Other Debt : Credit cards and other debt

The data is sourced from the Federal Reserve and all values are adjusted for inflation to 2013 dollars.  The 2016 data will be published over the summer and I am planning to update the calculators and this chart to show additional trends.

We used the data for the 40-60th percentiles to create a weighted average net worth of what makes up the wealth of an average household, and to represent the middle class. Because it is a weighted average (mean), the net worth values are skewed slightly higher than a median based calculation.

Summary Table of Net Worth for the Middle Class

Note: these values are adjusted for inflation into 2013 dollars.

Year Total Assets Total Debt Median Net Worth
1992 $131,000 ($48,603) $82,397
1995 $152,434 ($63,897) $88,537
1998 $171,146 ($67,091) $104,054
2001 $185,715 ($68,590) $117,125
2004 $213,655 ($93,009) $120,646
2007 $250,588 ($111,403) $139,185
2010 $185,185 ($97,994) $87,191
2013 $161,126 ($76,052) $85,074

If the graph doesn’t load here is an image:

Measuring and Tracking your Financial Progress

The best thing about tracking and setting goals is that you are in total control of what you want to track and how you want to track it. At work, I typically have goals and metrics cascaded down to me from above whether or not I agree with those metrics and goals. For my personal finances it’s freeing to be able to set my own goals and decide how I want to measure success. Read on for examples of metrics and processes that you could use to track your financial goals and progress.

How I’m tracking this year

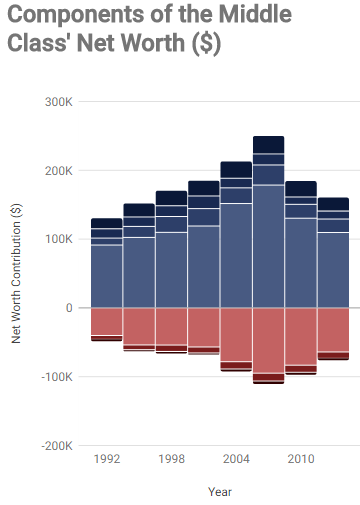
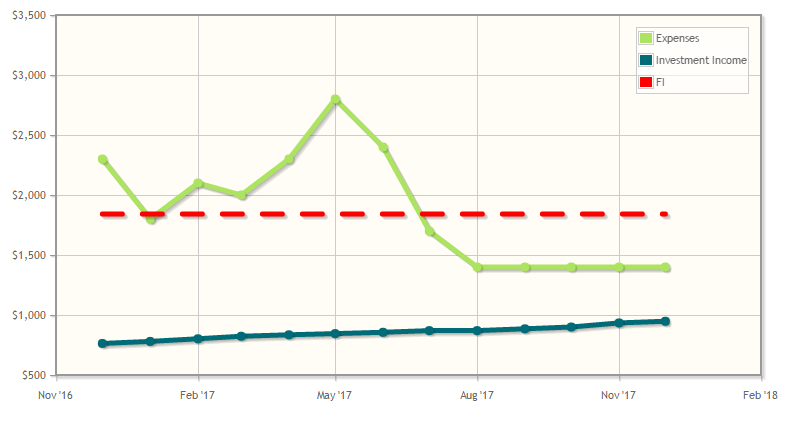
For this year, I decided to set my goals by loading my planned spending, income, and net worth in MadFienst’s lab and compare my end of month actuals to the plan. As each month goes by, I overwrite the planned numbers with actuals. Here’s an example graph with actuals thru March.

Planned and actual

How other people are tracking their goals and measuring their stats

I frequent the Rockstar Finance Forums and one of the things I wanted to find out was how others measure their financial success. I reached out to some of my fellow forum goers to get some new ideas. Here some of them.

setting targets

1. Setting SMART goals (specific, measurable, achievable, relevant, timely)

To recap, in 2017 I’ll measure how I’m doing financially on the following goals:

  • Increase year-over-year net worth growth with 50%
  • Invest 10% of my take-home pay in the stock market
  • Establish a concrete plan for building a new source of income

Probably not the most ambitious goals for a year, but I’m content with setting goals that’ll allow me to spend little time thinking about finances right now. The first two are done more or less by the “autopilot” I’ve set up to manage my finances. –

Better Goals for A Better Year – Abovare

2. Tracking year over year percentage increases

I do a monthly Net Worth check up and use the value $10,000 as my over/under on a good month. That would represent about 7/10’s of 1% increase. If I hit it 12 months a year I get an annual up 8.3%, I am good with that. I also do a year to year comparison in October (have been for 10 years) to see what % I am up for the year compared to other years. This fluctuates a lot but averages, 21.9% up a year. Year Over Year Net Worth – Othala Fehu

3. Focusing in on simple goals like generating passive income

I keep things simple. Long ago I worked out what it costs to be me, to live my life largely how I want it to be. Bollocks to frugality and minimalism and all that compromise.

I then set about building a passive income generating machine to fund that lifestyle.

In a given month where I earn more than I need, I do the happy dance and embarrass the hell out of my kids.

Alternatively should I earn less than that I curse the financial gods, before slapping myself upside the head for not being accountable for my own f*ck ups. Then I go figure out where things went awry.

Usually it is something simple like a void period between tenancies, or the result of a significant splurge such as an extended holiday.

On the rare occasion that it isn’t so easily explained I go looking for the underlying reason… maybe lifestyle inflation, or perhaps an increase in fees or interest rates or whatever.

In summary: Celebrate the small wins, which means if you’re doing it right you’ll be celebrating often. When you’re not figure out why, then do something about it. And repeat. Cantankerous.life

4. Managing spending

We mainly look at our spending. We automated our investments and only invest in index funds so the investing part is pretty straight forward. On the spending side, we focus on our biggest expenses and try to cut down all the fluff. Open Book Frugal – Our Financial Path

5. Managing debt and looking forward to milestones

I do a monthly net worth check and want my net worth to go up more than the previous month’s change. Now that I’m out of the bad debt repayment portion of my plan and more into the stock market, that is sometimes difficult with the crazy market fluctuations. So to keep it going up, I’ve got to keep paying more into savings/investments and to keep paying down the “good” debt.

I also look to hit some major milestones every year and if I don’t, I don’t consider it a success. Things like max out 401k contributions and increase in savings/non-retirement investments. I also have some spending goals like home renovations and car purchases that I want to pay for in cash. And a cool vacation for the mental break from everything!80-20 Your Finances

6. Publicly tracking and reporting on your status

For the last couple months I have been doing a monthly net worth check and, this month I started posting it on my blog http://buybackfreedom.com/march-monthly-report/3

I also posted my goals, they are very simple at the moment, I want to hit a net worth number by the end of the year and I want to invest 3k into dividend yielding stocks. Every month from now on I’ll simply look at how much time there is left in the year to see if I’m saving enough or if I need to bump that number up next month. Buy Back Freedom

7. Using Mint to budget and track spending

This is an awesome idea for a post. I track our budget closely with Mint to make sure we’re staying on track with our spending. I also track our net worth each month using Mint and Personal Capital. Based on what we’re spending, how much money we’re putting towards our debt, and how much our net worth has grown, I get a good idea on whether we’re continuing in the right direction.

Here’s a post where I talk about my goals for 2017:End of Year Review & 2017 Goals – Spill Spot

8. Using personalized spreadsheets of spending.

I use Personal Capital and lots of Spreadsheets. I track monthly spending, update net worth monthly, and track net worth growth goals year over year, and I also have a retirement accounts growth projection / goal tracker with a countdown to what we need. Life Zemplified

9. Being analytic to create rolling averages to track progress versus budget.

We track our income, expenses, and net worth in Quicken and monthly we prepare a spreadsheet to show our progress compared to our budget, including a rolling 12-month average of actual expenditures in each category. We then make revisions when necessary to get us back on track to achieving our desired results. Our 5 Big Personal Finance Goals for 2017 – Super Savings Tips

9. Tracking net worth and tracking cash flows

I measure my net worth each month, and have done for some years.

I’m reasonably relaxed about investments ups and downs, but monitor our cash movements like a hawk!

i.e. we should be £x up this month, but we’re only £y – why? I allow for regular savings etc, but I expect our monthly cash to build each month, until I move it to an ISA / savings account, so if it hasn’t gone up as much as I expect – time for a deep dive!Cracking Retirement

Average American Debt by Age and Type of Debt

Using data from the NY Fed’s Graying of American Debt, here is average total debt by age and type of debt for 2015. The number in the inner circle is the age of the debt holder, and the donut slices are scaled to represent the amount of debt in dollars. Hover over the slices to see the average debt amount in dollars.

Debt by Age Aster Charts

On a high level, overall debt:

  • Age 25: $19,700
  • Age 35: $57,600
  • Age 45: $73,700
  • Age 55: $61,500
  • Age 65: $48,300
  • Age 74: $29,300 (last available data is for age 74)

Find past home prices if Redfin doesn’t show it

Recently I’ve been on the house hunt, and Redfin and Zillow have been great resources at trending home values and seeing how prices have changed as homes are sold over the years–the before and after pictures are my favorite.  Sometimes though, if a home hasn’t changed hands in the last 15+ years, Redfin and Zillow might have incomplete transaction history.

My SO and I live in Chicago in Cook County, Illinois, and we can search the County’s Recorder of Deeds website for past transaction history.  Unfortunately, Cook County’s search doesn’t search by address, so I’m going to share a few quick instructions to using it. Depending on your county, you may have an easier time finding transaction history.  All of this information is 100% public, just not always easily accessible.

Find the Property’s Redfin Profile Page

This home only shows the current listing price on Redfin's property history.
This home only shows the current listing price on Redfin’s property history.

Here’s an example of missing data.  This home was built in the late 90s, and was last sold in the early 2000s.  For whatever reason, Redfin only shows the most recent listing in the property history.   Sometimes Zillow will have more information, but in this case Zillow also showed nothing except for the listing.

Look for the Parcel Identification Number under the Property Details

Cook County’s Recorder of Deeds uses a Property Identification Number (PIN) to search for transactions related to properties and deeds.  If you don’t live in Chicago/Cook County, you may still need the PIN or you might be able to search by address.  The PIN is found under the Property Details with in subsection Property / Lot Details.

Find out who Keeps records of deeds

So this is going to be the most confusing part.  Depending on which state you live in, you’re going to need to find the local government office that handles deeds.  This could be the Register of Deeds, Recorder of Deeds, County Auditor, County Clerk, etc.  Usually it is on the county level.

For me, it’s the Cook County Recorder of Deeds.

Go to your county's Recorder of Deeds or equivalent office.
Go to your county’s Recorder of Deeds or equivalent office.

Once you find out where to go.  Search for the property using the PIN from Redfin or address depending on the system.

My county’s page will pull up a ton of different real estate related transcations.  Your county might show more, less, or have a different format.

Find the warranty deed transactions.

In my county, the Warranty Deeds are the important ones.  The amounts listed on these deeds match up with the past sales on Redfin and Zillow.

We found it!
We found it!

Ta da!  Success! This property was last sold for $345,000 14.5 years ago.  I really like adjusting past sale prices with inflation to see how the home’s price has changed compared to inflation. Usually, I like to use the Bureau of Labor Statistics CPI calculator.  Adjusting for inflation, that home last sold for $467,165 2017 dollars, so the current listed price just barely outgrew inflation.

Share in the comments if you had to change some of the steps for your local area!