Historical Redfin Estimates are Constantly Changing

I was looking at my home's Redfin estimate chart, and the historical estimated property value was surprising when I noticed it said we overpaid by 10%. That was very surprising, since at the time several other units in our building were sold for the same price as what we paid. Plus, we purchased with a Redfin realtor and I would have remembered if there was so much of a difference between the estimated value on Redfin and the current price. I had originally thought that the historical value estimates represented the value that they thought it was worth on that date. For example, if it was Jan 2021, you would lock in an estimate and that was what would show up forever as the Jan 2021 estimate.

Redfin has been sending us an email with the estimate every month.

Emailed Redfin Estimate from Jan 2019 vs what showed up on the website for Jan 2019

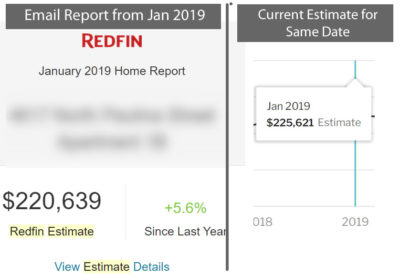
Lucky for us, we had signed up for Redfin's Home Reports a couple years ago which included a snapshot of the estimate at that moment, which is what I thought the graph originally represented. A lot of the emails also include a value for the percent change from last year or last month. Here's a plot of the results of those emails versus what was live on Redfin when I wrote this article.

Older Data is More Variable

Looking at my property as an example, there are some trends with more recent results being more consistent with the point-in-time estimates. The 2+ year old estimates are showing a relatively large amount of difference. An important fact to note is that the sale prices of comparable units in my building and neighborhood have been flat for this entire time duration. So it seems to me that their algorithm to pricing the estimates seems to trend towards painting a rosier picture of the market. The upward graph in the current price estimate does make me feel good, but it's really just fake.

Digging into the Details of the Change Since Last Year and Last Month

As I mentioned before, most of the emails contained an additional data point of change since last year or last month. None of those year-over-year or month-to-month changes was ever a negative, so I believe they must just omit the value if it isn't positive. Here is a chart with each email's data points plotted with the estimate from that month with a line that goes to the implied price based on the percentage change since last year or last month. These values (gray lines) are plotted next to the most recent Redfin Estimate.

The 2018's estimated values are all over the place with estimates ranging from $209k to $240k over a few months timespan.

Be a little cautious with the estimates

The values on Redfin can be useful, and I still use them frequently. But, this example has really highlighted to me how much these numbers can change over time on a whims notice. Now that I think about it, it's not too surprising to me that they restate their numbers historically as they update their data models. But what is really surprising to me is just how much the estimates can very month to month in a stagnant market.

Update 2022, I've updated the charts based on the last 2 additional years of data since I originally posted this. The estimates are still being heavily restated regularly. In fact, in the 2 weeks since I received my Home Report email there has been a massive lift in the value estimates from $255k in the email to $264k on the owner dashboard. In light of the recent Zillow fiasco where they tried to flip houses, I wonder if they had a similar issue with fudging the historical numbers. It certainly is much easier to make a model look far more predictive, if you get to backdate all your estimates.

Top Jobs to Earn $100k+ per year before you’re 30

I decided to look into which careers are the most rewarding early in your career. Most of the jobs aren’t a surprise with Software Engineers topping the list with almost 60k young adults under the age of 30 earning over $100k. This means about 21% of Software Engineers between the ages of 20-29 are making six figures annually. Here’s a treemap of the top jobs of 20-29 year old Americans who earn more than $100,000 per year.

Continue reading Top Jobs to Earn $100k+ per year before you’re 30

Peer To Peer Lending Returns Look Terrible

I recently came across a dataset on Kaggle from a popular peer to peer lending company with data up to 2/2019–the start date was in 2007 but there weren’t that many loans from the early years. I’ve been reading other FIRE/personal finance bloggers touting more non-traditional investments, and I was a little bit interested to see the overall average performance of these kinds of instruments. Sometimes you never know if the bloggers are just pushing a product because it’s good or if they’re after ad money. So to find out, I decided to fire up R and run some quick analysis on the returns and my goodness they are very terrible.

36 Month Loans

Looking at 36 month (3 year) loans that have had at least 3 years between the start date and the data set’s end date, the returns are terrible. The only thing nice I can say is that at least it looks like you average a slightly positive return.

Grade# of Loans# BadTotal ReturnAvg Int Rate
A1557625.5%107.1%7.2%
B23083511.3%108.8%10.8%
C17555018.2%108.4%13.9%
D8128623.7%107.7%17.2%
E2342529.1%105.8%19.8%
F482933.7%104.2%23.4%
G76639.3%102.1%24.4%
A 7% return in 3 years?!?! What a terrible club to be in.

That total return is the total amount paid out over the life of the loan. A total return of 107.1% is basically an interest rate of 2.28% per year compounded each year. That’s pretty close to what an Ally CD would yield for the same period, which is pretty sad considering the amount of risk you’d be taking on to give out these loans to people. % Bad is the percentage of the loans that have negative statuses like charged off, grace period, or late.

How does this number work?

Screenshot from this company’s page. Captured 7/27/2020

Okay so I was thinking maybe I made a calculation mistake or the data on Kaggle was bad, so I went over to this company’s website to get the official public stats. They don’t make sense to me either. This company only offers loans of 36 months (3 years) or 60 months (5 years). So I picked issue dates up to 2014, so all the loans are paid off or charged off–nothing is outstanding.

Looking Grade A loans, their website has total payments of $740,746,894 = $669,115,583 (principal payments) + $71,631,311 (interest payments).

They issued $686,112,100 in loans. Simple division puts this return at $740,746,894 / $686,112,100 = 1.0796 meaning they got paid 7.96% more for loans that took 3 to 5 years to complete.

How in the heck do you get an annualized return of 5.14% over 3 to 5 years when the total return is 7.96%? None of this makes any sense to me, but maybe my untrained eye has just grossly misunderstood the basic figures on the dashboard.

Dropping Microsoft Office At Home

I recently got a new computer, and decided to go back to the Microsoft Home Use Program to get a new key to get Excel installed on my new computer. Much to my surprise they’ve completely gutted that program and the package now costs $70 / year for one license or $100 / year for 6 licenses. This is a huge increase when it was only $20 for a permanent license as recently as 2018. Now my old computer is completely gone, so I kind of gave up on rescuing my old license some how.

Free Alternatives : LibreOffice, Rstudio, and Google Sheets

As you know from this website, my typical data analysis toolkit is Excel, R and PHP/Javascript, so I’m currently exploring the open source options. So far, I’m really getting used to LibreOffice. LibreOffice is related to OpenOffice, but has been kept more up to date than OpenOffice. It looks like OpenOffice has basically been frozen in time for like 5+ years and really isn’t a great option at this point. A lot of the functions are the same as in Excel, but the only bad part about LibreOffice is that it feels a lot like using Excel 2003 from the UI perspective. It just isn’t as slick and fluid as the newer versions of Excel, but it does seem to be getting the job done. Pivot tables work, and the structure is very similar to how they are used in Google Sheets.

libreoffice screenshot
LibreOffice looking very 2005.

I’ve also started to lean a little bit more heavily on R (specifically RStudio) to do exploration via coding vs spreadsheet style. It certainly has been a learning curve, but I also feel like R is a marketable skill. I’ve also been using Google Sheets quite a bit for smaller spreadsheets, but Google Sheets feels a little clunky if you try to use a sheet that’s large.

Is the Microsoft Home Use Program worth it for some people?

Yes, it is worth it if you are going to use the 1 terra byte in free cloud back up. If you’re a light user of Docs, Excel and PowerPoint, LibreOffice or Google Docs should cover you pretty well for free.

If you’re trying to run a business from home, I could also see it being useful in situations where you’re going to be sharing files with clients or contractors. I can see it being important to make sure that your files are formatted perfectly across computers. For me, since my hobby data analysis work isn’t really shared via Excel, I don’t think that it’s worth an extra $70 / year for that.

How much extra does Instacart delivery cost versus Kroger pickup?

With all the coronavirus stuff, I’ve started to use Instacart more to shop at my local grocery store Marianos which is owned and run by Kroger.

With my latest cart, I was curious how much Instacart was charging versus the store. There’s a little vague note that I’m getting the Everyday Store Price, but I’m not sure what that actually means in practice. Instacart defines it as:

Standard store pricing. Loyalty cards not accepted. Most in-store sales, promotions, offers, coupons and discounts do not apply. Instacart specific coupons, promotions and discounts available. Price as displayed. 

The Instacart total
The Marianos / Kroger total.

So let’s get started, this is what my final Instacart receipt looked like with Everyday Store Pricing. $201.65 on products and tax, and then the remainder $44.26 on service, tip, and delivery fees.

Compare this to my Kroger pick up total of $194.45 for products and taxes. I added every single thing–including replacements–from my finalized Instacart order to the Kroger Clicklist order. Kroger pickup will give you the sale prices which is the cause of the difference between the Kroger subtotal and the Instacart subtotal. Because of this, I missed out on some BOGO bread, which I’m a little sad about now that I know about it.

There’s something odd about the tax total that I don’t understand how the Instacart value has lower taxes with a higher subtotal compared to the Kroger tax total on a lower subtotal. I’d imagine that there’s probably something wrong going on with Instacart’s algorithm that they’ll get in trouble over in the future.

So because Instacart charges about $10 more for the same products, I am in essence paying an even bigger premium for the grocery delivery than I originally expected.

In total adding up everything I basically paid $51.46 or a premium of almost 20% for someone else to deliver for me. versus if I had a Kroger employee shop for me and I picked up. Granted I could have shorted the tip a little bit (from 15%), but that seemed rude to short change some when I personally didn’t want to risk getting infected by going shopping myself. But you know, there’s definitely a lot of cost savings to be had if you’re willing to do the pick up.

Edit 4/26: We just got an Instacart from Aldi, and the shopper left the receipt. The total from Aldi was $188 with tax, and Instacart charged $207 for the products + tax, so the hidden Instacart price inflation ray was about 10%.