I recently came across a dataset on Kaggle from a popular peer to peer lending company with data up to 2/2019–the start date was in 2007 but there weren’t that many loans from the early years. I’ve been reading other FIRE/personal finance bloggers touting more non-traditional investments, and I was a little bit interested to see the overall average performance of these kinds of instruments. Sometimes you never know if the bloggers are just pushing a product because it’s good or if they’re after ad money. So to find out, I decided to fire up R and run some quick analysis on the returns and my goodness they are very terrible.
36 Month Loans
Looking at 36 month (3 year) loans that have had at least 3 years between the start date and the data set’s end date, the returns are terrible. The only thing nice I can say is that at least it looks like you average a slightly positive return.
| Grade | # of Loans | # Bad | Total Return | Avg Int Rate |
| A | 155762 | 5.5% | 107.1% | 7.2% |
| B | 230835 | 11.3% | 108.8% | 10.8% |
| C | 175550 | 18.2% | 108.4% | 13.9% |
| D | 81286 | 23.7% | 107.7% | 17.2% |
| E | 23425 | 29.1% | 105.8% | 19.8% |
| F | 4829 | 33.7% | 104.2% | 23.4% |
| G | 766 | 39.3% | 102.1% | 24.4% |
That total return is the total amount paid out over the life of the loan. A total return of 107.1% is basically an interest rate of 2.28% per year compounded each year. That’s pretty close to what an Ally CD would yield for the same period, which is pretty sad considering the amount of risk you’d be taking on to give out these loans to people. % Bad is the percentage of the loans that have negative statuses like charged off, grace period, or late.
How does this number work?
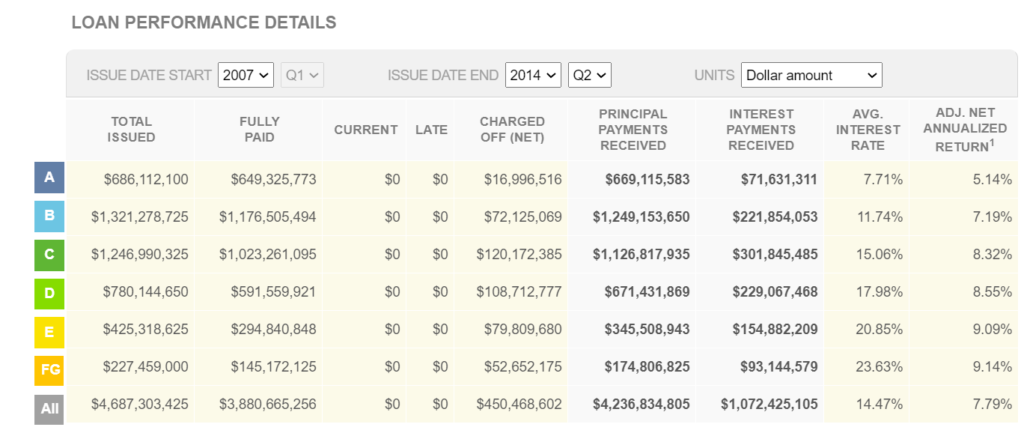
Okay so I was thinking maybe I made a calculation mistake or the data on Kaggle was bad, so I went over to this company’s website to get the official public stats. They don’t make sense to me either. This company only offers loans of 36 months (3 years) or 60 months (5 years). So I picked issue dates up to 2014, so all the loans are paid off or charged off–nothing is outstanding.
Looking Grade A loans, their website has total payments of $740,746,894 = $669,115,583 (principal payments) + $71,631,311 (interest payments).
They issued $686,112,100 in loans. Simple division puts this return at $740,746,894 / $686,112,100 = 1.0796 meaning they got paid 7.96% more for loans that took 3 to 5 years to complete.
How in the heck do you get an annualized return of 5.14% over 3 to 5 years when the total return is 7.96%? None of this makes any sense to me, but maybe my untrained eye has just grossly misunderstood the basic figures on the dashboard.
I tried using prosper a few years ago and the returns were ok at the beginning until I got a few defaults.