Compare your net worth against the wealth distributions of American Millennials, Baby Boomers, Generation X, and Generation Z.
Your net worth of $0 would rank above:
Gen Z 22.78%
Millennials 12.8%
Gen X 6.83%
Baby Boomers 3.77%
Silent Generation and Older 2.3%
Gen Z 22.78%
Millennials 12.8%
Gen X 6.83%
Baby Boomers 3.77%
Silent Generation and Older 2.3%
Share These Results :
These results are based off of individual samples from the 2022 Survery of Consumer Finances and are weighted to represent all American households. The SCF is known to be slightly biased towards higher incomes values, which the Federal Reserve attempts to correct for by adjusting the weighting of each individual response. Keep this in mind if the number of responses your output is based off of is low, or if you are looking at the tail ends of the data--like the top 1% or bottom 1%.
How to interpret
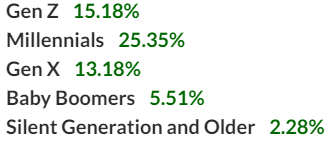
In this example of a net worth of $0, for Gen Z in 2016 (the recent results will show different percentiles) you would rank above 15.18% of households in wealth, meaning that 15.18% of households would have less than $0 and 84.82% would have more than $0 in net worth. An important thing to keep in mind also is that the older generations are literally older as this is based off a survey of wealth taken in 2016, so they have had more years to work and it shows in the wealth distribution.
Generations Defined
Because this is using data from 2022, Generation Z has a small sample size and may not be as representative as the other generations. I categorized each sample from the SCF based on the age of the head of household.
- Generation Z: 26 years or younger. This data is very sparse and may not as reliable as the other age groups, since during the survey period most Generation Z people would be dependents of other households. Those Gen Zs who were independent and were sampled are likely not very representative. A better read of their wealth tracking should be available in the next publication of the SCF.
- Millennial : Households 27-41 years old
- Generation X: Households 42-57 years old
- Baby Boomers: Households 58-76 years old
- Silent Generation and Older: Households older than 77 years old
You may be wondering why the households 70+ show up as very wealthy, and I believe there may be some bias in that poorer people tend to die off earlier due to lack of healthcare and resources leaving a disproportionate number of elderly wealthy people. Overall for all Americans, by age 70, there is a 20-30% chance (depending on your gender) of dying before that age.
Net Worth Percentiles by Generation
Here is a table of the percentile rankings of how much wealth a household would need to rank at a certain percentile in their generation in 2016. Silent Generation and Gen Z have been excluded due to lack of horizontal space.
| RANK | MILLENNIAL NET WORTH (IN DOLLARS) | GEN X NET WORTH (IN DOLLARS) | BOOMERS NET WORTH (IN DOLLARS) |
| 90% | $183,590 | $807,500 | $1,895,700 |
| 80% | $87,850 | $398,900 | $853,610 |
| 70% | $48,910 | $223,900 | $464,500 |
| 60% | $25,000 | $146,901 | $303,200 |
| 50% | $12,200 | $85,270 | $188,500 |
| 40% | $5,650 | $42,000 | $116,900 |
| 30% | $1,020 | $17,930 | $56,180 |
| 20% | -$4,880 | $4,470 | $16,780 |
| 10% | -$26,250 | -$3,990 | $1,880 |
my annual retirement income from the military and civil service and social security is $140,000.00. All is tied to a survivor benefit program for my wife so she will get about 60% of my income—does this add to my calculated net worth of $2.3 million
You should try to price out what an equivalent annuity would be for the same amount per year if you were to buy it right now and then add that to your net worth.
Who said those military and civil service jobs don’t pay well.
A very small percentage retire as a Colonel. He put up with a lot of hell and headaches where most people would probably throw in the towel. Instead of leveraging his military time to the civilian sector he decided to continue to serve his country as a civilian. He paid Social Security. He was paid less over the length of his career than he would have earned on the outside. The lifelong commitment service for men committed to give it all to their country is not what I would call well paid, but well deserved.
I love the way people who work “in service of the country” always say that if they had worked in the private sector they would have earned more. Is that narcissistic or what? I can almost guarantee you that if they had worked in the private sector, they wouldn’t have $140,000 guaranteed income in retirement.
“I believe there may be some bias in that poorer people tend to die off earlier due to lack of healthcare and resources”
Well I believe it’s also largely because many poor people make poor life style choices. They consume excessive amounts of liquor, are overweight, don’t exercise, don’t eat well, and don’t follow medical advice (from my nephew, a doctor in the not ritzy part of NYC). Even with Medicare for all, there would be little change in these stats for poor people (something about leading a horse to water…)
No question about the $140K amount from the private sector – unless you are a director or higher. To earn that much in benefits you’d have to max-out on SSB, retired a Colonel, and have held a fairly high-level CC job for years. Few people do this – you are among them.
https://www.bls.gov/ooh/management/top-executives.htm
Job outlook is about 8%. Median pay was $185,950 in May 2020. If you’re going to compare Colonels to the private sector, you would be comparing them to CEO’s. At that level, the benefits packages are generous. He would absolutely be making more in the private sector at that level.
By comparison, the job outlook for Colonels is about 5%.
The Employed U.S. labor force was about 150 million people in OCT 2020. Top Executives make up about 2.7 million. That’s 1.8% of the workforce that are Top Executives making the above median income.
Compare that to officers, which totaled 234,336 in Sep 2020 (18% of the U.S. military.) 11,246 of which were O6 (Colonel level – 4.8% of officers). That means that O6’s make up about 0.86% of the military workforce.
According to the Bureau of Labor and Statistics, the median annual wage for chief executives was $185,950 in May 2020. How much do you want to bet that their benefits packages exceeded that of a Colonel? If you’re going to make the comparison, you have to do so at the level that the individual would be equivalent to in the private sector. Colonels are put in charge of large commands and are equivalent to top-level company executives. According to the statistics, there’s a higher percentage of the workforce that are Top Executives than there are Colonels.
Agreed. While to many, Full-Bird Colonel PJM’s retirement income may seem “too high”, getting to the rank of Colonel is no small feat; probably roughly equivalent to a Director-level or above person in the private sector, which is what I was in my working years. And my retirement income while not as high as Colonel PJM’s, it’s pretty close. The difference between his and mine is mine is highly dependent on my investment management decisions; his aren’t and I have no problem with that. Thank you for your service, Colonel PJM…
“Well I believe it’s also largely because many poor people make poor life style choices. They consume excessive amounts of liquor, are overweight, don’t exercise, don’t eat well, and don’t follow medical advice (from my nephew, a doctor in the not ritzy part of NYC). Even with Medicare for all, there would be little change in these stats for poor people (something about leading a horse to water…)”
We can take your bad argument point by point to demonstrate an abundance of ignorance, a lack of understanding, and lack of empathy.
Excessive amounts of liquor: while the data tends toward this conclusion the bald statement of it completely ignores everything that leads to this end. The higher concentration of liquor stores in poorer areas, the societal pressures to drink, exposure to violence and other aspects of poverty leading to other somewhat detrimental behaviors, alcohol being a cheap and legal way to mentally escape poverty for a bit. Ignoring the reasons why people make choices is bad.
Overweight: again the data tends toward the conclusion that those living in poverty tend to experience being overweight at higher rates than those not in poverty. Again, however, you ignore why that is. Setting genetics and health conditions unrelated to diet aside, poor people can’t afford to eat healthy. They live in food deserts. The calories they can afford aren’t high quality. They don’t have time to cook because they’re too busy working to barely survive.
Don’t exercise: I haven’t seen data on this but won’t argue the point because who has time to exercise when they’re working two jobs? People living in poverty don’t have time to exercise as a general rule.
Don’t eat well: see “overweight”.
Don’t follow medical advice: People living in poverty often can’t get to a doctor. If they can they often can’t get to the pharmacy. If they can do that they often don’t have the money for the prescription, or therapy, or whatever else is recommended. Most often what doctors prescribe boils down to “stop living in poverty”. It takes time and/or money to go to the doctor, go to the pharmacy, keep up on expensive prescriptions, eat healthy, exercise, rest, and do everything else doctors say to do. If you tell a poor person they have to take 10 units of insulin every day, but the person can only afford 5, they’re taking 4 because they don’t want to run out and some is better than none in their eyes.
Poverty is not caused by poor morals, stupidity, or anything else you so heavily imply. It is caused by a lack of money. And when people live in poverty they make the best choices they can with the resources they have available. And when people live in poverty they often become quite loss-averse – so taking the chances the American economy demands to get out of poverty doesn’t seem like a good idea to somebody already against the wall.