Supply Chain Professional Salary Progression 2018

Years ago, I used to wonder what my future in supply chain management would be like. With so many different career paths ranging from purchasing, warehousing, transportation, manufacturing, there were a lot of variables to consider. Now with years of experience behind me, I decided to collate together several supply chain salary surveys together. I can compare how well I’ve done in comparison and see what might be coming in the future.

Salaries rise quickly but plateau

As you can see, salaries start at around $67k on average early in a career. They slowly rise to $120k towards the end of a career. This implies that the natural rate of growth per year of experience is about 1.69% annual raises (assuming no inflation) over a 40 year career. That isn’t terrible but isn’t great either. In the first 10 years, the gains per year of experience are significant as the growth rate is nearly double at 3.17%.

The mid career plateau is very evident in that flat section around 10 years of experience to 25 years. At this point in your career people are moving into senior roles. In corporate, that would be senior individual contributor role like managers with no direct reports or senior analysts. In field positions this would be similar to being a manager who is directly still leading front line workers.

The growth rate implied for these years is barely above zero at 0.28%. From my own experience, this period time causes a lot of soul searching. The first few promotions were comparably easier to earn, so hitting that individual contributor cap might feel like a ceiling. And, this frustration boils over into turn over as people get past up for promotions or opportunities. Also some people get complacent and get expensive relative to their output/skill-set. This becomes a risky position during layoffs when a cheap new grad may start to look like an affordable replacement for a senior associate with stale set of skills.

I think I’m getting to the Plateau

I used to worry myself with questions like how quickly should I be promoted. Or I would compare myself too much to my peers and how they were being rated. It’s hard when you’re starting out to figure out what’s normal or not. Looking at my own personal growth, my income started a little bit below the average but quickly shot up as I got performance reviews and promoted. After that whirlwind of upward trajectory, I am getting the feeling that I’m approaching the plateau. As I’m compensated well above average at this point, but I don’t really have an interest in management yet. When I look at my career progression and prospects there isn’t a lot unless I do pursue management or switch into something much more technical like data science.

Sources and Methodology

I created the graph using the listed supply chain salary surveys. The average line is all 4 survey averages averaged by years of experience, the Highest Survey Average Salary represents the survey with the highest value for that experience, and the Lowest Survey Average Salary represents the lowest value for that experience.


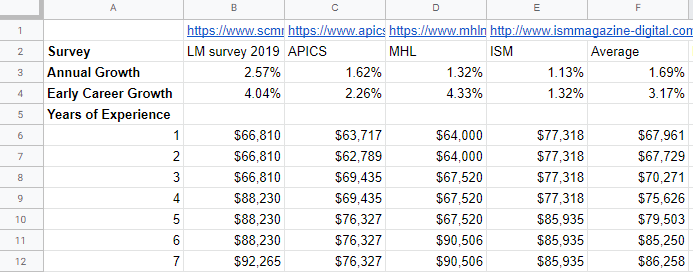
Because the years of experience ranges were not exact matches, I populated this table with each year of experience and listed the salary for the experience range for each year. I then averaged across using those values:

Interestingly, the 21-29 age range on MHL salary is $58.7k, which is lower than their listed cohort of 1-2 years at $64k. This seems to suggest that people entering the supply chain profession are slightly older than the 21-29 age group. They also probably have professional experience in other areas. If you are a recent or incoming college graduate, do not despair if your salary is more in the $50ks. It’s totally normal. Your salary will grow quickly if you work hard and show some aptitude.

Since only one of the surveys provided median and average numbers, the numbers presented are using averages. You should keep in mind some highly compensated employees will be represented in the more experienced buckets. Also a lot of these surveys don’t have very deep survey pools and tend to only ask their membership for responses. This could be a problem because the people who are in these trade groups tend to be more involved at work or are high potential individuals who probably earn more.

Sale Price per load of Top Laundry Detergents

I keep track of way too much, and this is one of the rules of thumb that I’ve built up over the years when I’m shopping around for laundry detergent. It’s no secret that a lot of these laundry detergent companies like to make their sales complicated, so I focus on the sale – coupon price per load and if there’s anything else that’s gravy. Also the prices seem to rotate between retailers, so when one place doesn’t have a sale on your preferred brand, another nearby store will have it for sale. One big thing to watch out for is that the normal prices of larger bottles is always lower per load, but during sales the prices of the smaller bottles seem to drop a lot more than the bulk sized bottles.

Laundry Detergent Brands

Tide

  • Normal price : $0.20 – $0.30 / load depending on bottle size
  • Good Sale Price : $0.16 / load. These sales are pretty frequent.
  • Really Good Sale Price : $0.08 / load. This only happens a few times a year and usually won’t repeat at the same retailer.

Persil

  • Normal price : $0.20 – $0.30 / load depending on bottle size
  • Good Sale Price : $0.125 / load
  • Really Good Sale Price : $0.08 / load

Purex

  • Normal price : $0.12-$0.20 / load depending on bottle size
  • Good Sale Price : $0.08 / load
  • Really Good Sale Price : $0.04 / load

Arm & Hammer

  • Normal price : $0.10-$0.25 / load depending on bottle size
  • Good Sale Price : $0.08 / load
  • Really Good Sale Price : $0.04 / load

Share of income earned by the Rich by state ($1m+/year)

Nationally, a small fraction of households report incomes of $1 million or greater per year. But at a rate of about 3 out of 1000 households (0.28%), it is more common than you might think. There might a secret millionaire earner in your contact list.

A few states stand out nationally as having relatively percentages of these ultra earners. The coastal north eastern states earn their reputation as being abnormally wealthy. Several have rates of up to twice has high as nationally (see table):

CONNECTICUT0.63%
DISTRICT OF COLUMBIA0.60%
NEW YORK0.51%
MASSACHUSETTS0.47%
NEW JERSEY0.43%

While there are only 424,870 of these $1m+ households, out of a total of 149,853,100 in the country. They earn a very large share of the nations income, racking in over 13% of total income.

Income share of total income by state earned by households with $1m+ reported income to the IRS.

The list of bottom states for high earners is unsurprising with West Virginia topping that list at a rate of 7 out of 10,000. It’s not exactly a bad thing to have a low portion of ultra high earners in your state. Having a low percentage implies that there is probably a larger amount of income equity in the local economy. But since each state is part of the larger US, having a lower fraction may also imply that certain states are less desirable or economically productive compared to others.

Raw Data by State 2016

Table by State and Percentage of Tax returns that are of households >$1 million in ajusted gross income. % of Total Income is a percentage that these households earned of all the income earned in that state in 2016.

State% of Returns% of Total IncomeTotal Returns
UNITED STATES 0.28%13.34%424,870
ALABAMA0.16%7.63%3,240
ALASKA0.19%5.96%660
ARIZONA0.20%9.02%5,830
ARKANSAS0.14%11.94%1,760
CALIFORNIA0.40%17.73%71,290
COLORADO0.29%11.79%7,660
CONNECTICUT0.63%22.19%10,990
DELAWARE0.19%6.73%850
DISTRICT OF COLUMBIA0.60%18.57%2,070
FLORIDA0.29%16.71%28,420
GEORGIA0.23%9.87%10,050
HAWAII0.15%6.75%1,010
IDAHO0.16%8.92%1,220
ILLINOIS0.31%13.40%19,180
INDIANA0.16%7.74%4,870
IOWA0.15%5.95%2,100
KANSAS0.20%9.10%2,610
KENTUCKY0.13%7.05%2,550
LOUISIANA0.19%8.99%3,830
MAINE0.14%6.20%940
MARYLAND0.28%9.54%8,170
MASSACHUSETTS0.47%17.77%16,160
MICHIGAN0.19%10.15%9,190
MINNESOTA0.25%10.36%6,970
MISSISSIPPI0.11%5.93%1,340
MISSOURI0.19%9.77%5,240
MONTANA0.15%7.46%750
NEBRASKA0.18%8.35%1,650
NEVADA0.27%20.14%3,770
NEW HAMPSHIRE0.23%10.37%1,590
NEW JERSEY0.43%14.23%19,070
NEW MEXICO0.11%5.68%990
NEW YORK0.51%23.37%48,570
NORTH CAROLINA0.19%8.60%8,660
NORTH DAKOTA0.19%8.01%700
OHIO0.17%7.69%9,560
OKLAHOMA0.17%8.54%2,760
OREGON0.20%8.47%3,790
PENNSYLVANIA0.22%10.13%13,860
RHODE ISLAND0.19%8.57%1,020
SOUTH CAROLINA0.18%7.77%3,880
SOUTH DAKOTA0.22%11.19%920
TENNESSEE0.21%11.01%6,160
TEXAS0.26%12.07%31,810
UTAH0.23%11.37%2,970
VERMONT0.16%6.86%520
VIRGINIA0.26%9.19%10,010
WASHINGTON0.30%13.88%10,600
WEST VIRGINIA0.07%3.23%550
WISCONSIN0.19%9.18%5,460
WYOMING0.29%18.57%770
OTHER AREAS [20]0.82%40.61%6,300

Sources

The source of these data tables comes from the Excel files available freely on the IRS website. The figures above are from 2016. https://www.irs.gov/statistics/soi-tax-stats-historic-table-2

Retail Loyalty Points are a Scam

Stores plan on you not redeeming store points/dollars/rewards that they offer. So don’t let them trick you when shopping this Black Friday and Holiday season with deals that sound better than they actually are.

Every store seems to have it’s own loyalty program that has a version of points, dollars, or rewards where you pay up front for a deal and they give you back the points for your next purchase. Retailers love to do this, because they get your money up front instead of offering a more traditional discount promotion where you get the savings instantly.

How to value Retail Loyalty Points and “Dollars”

Retailers have a concept called breakage:

Breakage: Is the percentage of points earned by customers that are never redeemed.

According to the Customer Insight Group 30% of retailer points is a fairly normal number for points to go unredeemed. One way to think about it is that stores plan to never have to pay out for a large portion of the points they give out. They could offer out points with the ‘value’ of $10 but only have to plan on paying out $7.

The breakage rate varies depending on a lot of factors that I’m sure you’ve experienced when trying to use these programs:

  • The points will expire quickly.
  • They need to be spent in large amounts.
  • Numerous restrictions on what can be purchased.
  • Hard to redeem.

When you look at the value that the store tells you, think about how likely you are to actually spend it. Also remember if the store values the points at 70% of face value–or even less–you probably should too.

Examples of Egregious Point Offers

The more onerous the terms; the higher the breakage. You see offers like this Sears ‘100%’ cashback on $250, with terms like:

They’re going bankrupt so uh this is a little risky.

  • Points are valid for 7 days
  • $25 points per week for 10 weeks
  • Points have no cash value
  • Terms can change at anytime

This is one of the more obvious rip offs, but I’m sure that there are a few of you out there could make this deal work if you happen to live next to the last Sears or Kmart with the lights still on.

Their terms bring up a lot of great examples of how retailers abuse point systems.  Because the retailers own the system of points, they can issue as many as they want. If they happen to over-estimate the breakage rate–meaning they made it too easy to redeem the deals– they can simply devalue their points or create new policies to increase the breakage rate.  You see this a lot in programs that reduce the amount of time you have to use the points, increase restrictions, or increase redemption minimums.

Points can be worth it, but beware.

There are a lot of programs out there that are worth it, but it 100% depends on your personal habits.  If it’s a store you go to frequently the loyalty programs are great ways to save and shop more.  But you need to watch out the offers to stores that you rarely frequent, because those are the most likely to not pay off.

Just to recap good programs will be:

  • Places you normally shop
  • Long expiration date (1+ year)
  • Flexible redemption amounts
  • Clear point to product valuations

Bad programs will be like:

  • Short expiration cycles
  • Multiple point/”dollar” types for the same store
  • A store you rarely go to
  • Long lists of product exclusions
  • Hard to manage rewards like papers
  • Confusing

Is Imperfect Foods Worth it?

Update 1/4/2021: It still seems like they’re sending random extra items with most of my orders. It’s actually pretty rare for anything to be missing so I’m not sure if this is intentional or not? Overall it’s kind of a nice surprise and if there’s something I don’t want one of my neighbors has taken it pretty quickly. Imperfect Foods has been a good balance of value for grocery delivery compared to Instacart especially with these bonus items.

Update 8/17/2020: I’m not sure what’s going on with Imperfect Foods, but they keep sending me random items with my boxes. I keep getting what I ordered (minus things they cut from the order) plus a bunch of random things, like I don’t know how you accidentally send me my exact order plus kombucha, milk, and cheese that I didn’t order.

Update 5/9/2020: So I decided to restart using Imperfect Produce because it seemed like a nice supplement to get food delivered with the shelter in place warnings. Imperfect Produce is now called Imperfect Foods and has expanded the product lines to some dry goods (grains), dairy, meat and seafood.

In terms of cost, it looks like the box fee went away and everything is a-la carte so you don’t need to sign up for the Meat & Seafood, Grains, or Dairy packs to actually get those things. Dairy, Meat, & Seafood is shipped inside an insulated box with an ice-pack. If you’ve done Blue Apron, it’s basically the same set up. I think in terms of pricing and quality everything seems about the same as before when I wrote this article a couple years ago. In general, the pricing is fair-ish but not really cheaper when you account for the size and weight of the produce, but they are very consistent about delivering on time.

Original Review: I’ve been using Imperfect Produce which is a vegetable and fruit delivery service for the past few months. Imperfect Produce aims to reduce food waste by delivering ugly and surplus fruits and vegetables to your door.  I liked the mission statement, but after a few months I felt like most of the food I was getting was labeled ‘surplus’ and prices seemed to be less competitive.   Delivery to delivery, I would often buy basics like carrots and onions that were always labeled ‘surplus,’ but if they’re available all the time are they really surplus?

One of the Imperfect Produce boxes
One of the boxes most things look pretty normal.


Another box with more fruit
The fruits were kind of small

So I broke out my kitchen scale, and I tracked 4 deliveries (2 months worth!).  I compared the amount that Imperfect Produce sent me and priced out the equivalent from my local grocer.  Everything was compared against a direct replacement as best I could match.  To keep it fair, I also included the Box Fee ($3) and Delivery Fee ($5) that Imperfect Produce charges.

Here are the cost comparisons by delivery:

  Imperfect Produce Grocery Store Savings over Store
Box 1  $31.85  $29.90  $(1.95)
Box 2  $32.78  $28.13  $(4.65)
Box 3  $33.76  $6.57  $(7.19)
Box 4  $29.01  $26.52  $(2.49)

As you can see, Imperfect Produce has cost more than the grocery store on all of my boxes.  If you subtract out the box and delivery charge the prices of the actual produce and fruits are cheaper, but once you include the total cost Imperfect Produce really isn’t a deal.

The actual produce usually looks pretty comparable to what is at the grocery store.  Some of the items (especially fruit) are often smaller than at the store, but really the most obvious things are like the carrots are almost always shaped like giant turnips and the onions tend to be either gigantic or tiny. Edit 1/4/21: Fruit has consistently been small and or bruised looking. I don’t know why, but vegetables almost always are in pretty good shape but the fruit is usually not.

Items that saved the most:

Item Imperfect Produce Cost  Store Cost  Savings %
Conventional Green Bell Peppers (2 ct)  $0.99  $5.56  $4.6 82%
Conventional Avocados (12 ct)  $7.74  $12.20  $4.5 37%
Organic Leek (2 ct)  $4.67  $8.18  $3.5 43%
Conventional Parsnips (1.5 lb)  $0.69  $2.30  $1.6 70%
Conventional Apples (3 ct) 1lb  $1.88  $3.15  $1.3 40%

Don’t use this to save money.

If you are looking to get your vegetables delivered this is totally a viable option that doesn’t cost much more than the store.  But keep in mind, you will generally end up paying more for the convenience of the having the box delivered. Selection varies week to week, so I do like using the boxes to try out different fruits and vegetables.  On top of that you’ll be helping out to reduce food waste, although I’m not sure how much of those savings are offset by the delivery and non-reusable delivery box.

If you want to try out imperfect produce and live in one of the cities here’s a link for your first Imperfect Produce box. As of this post, Imperfect Produce operates in many cities including:

  • San Francisco Bay Area, CA
  • Los Angeles, CA
  • Orange County, CA
  • Portland, OR
  • Seattle, WA
  • Chicago, IL
  • Indianapolis, IN
  • Milwaukee, WI

Grocery Delivery is Now Normal!

Added 1/4/21: Well with the times as they are now, I never thought that grocery delivery would be something that would be part of my normal routine. But here we are.

Imperfect Foods has some limitations compared to other grocery delivery companies. The grains, meats, and dairy selections are pretty basic, but I can feed my household on it so it works. The brands typically are more comparable to what you would find at Whole Foods or Sprouts, so it may be a little different than what you expect from like Kroger.

Compared to Instacart, the schedules are inflexible and you have to plan your orders days in advance. But on the other hand, I do find the total delivered to the door prices pretty comparable to Instacart and Shipt. Once you add in all the extra fees for a lot of competing delivery companies (tip, delivery, bags), the all in cost of Imperfect Foods starts to look pretty competitive (no tip, delivery fees are often waived if you spend enough).

I still stand by my original assessment that compared to in-store shopping, the savings really aren’t there. But if we’re comparing like-for-like Imperfect Foods is a very compelling option that I’ve started to use more of and would recommend as long as your ok with the selection, schedule, and don’t expect to save much money.