I keep track of way too much, and this is one of the rules of thumb that I’ve built up over the years when I’m shopping around for laundry detergent. It’s no secret that a lot of these laundry detergent companies like to make their sales complicated, so I focus on the sale – coupon price per load and if there’s anything else that’s gravy. Also the prices seem to rotate between retailers, so when one place doesn’t have a sale on your preferred brand, another nearby store will have it for sale. One big thing to watch out for is that the normal prices of larger bottles is always lower per load, but during sales the prices of the smaller bottles seem to drop a lot more than the bulk sized bottles.
Laundry Detergent Brands
Tide
Normal price : $0.20 – $0.30 / load depending on bottle size
Good Sale Price : $0.16 / load. These sales are pretty frequent.
Really Good Sale Price : $0.08 / load. This only happens a few times a year and usually won’t repeat at the same retailer.
Persil
Normal price : $0.20 – $0.30 / load depending on bottle size
Good Sale Price : $0.125 / load
Really Good Sale Price : $0.08 / load
Purex
Normal price : $0.12-$0.20 / load depending on bottle size
Good Sale Price : $0.08 / load
Really Good Sale Price : $0.04 / load
Arm & Hammer
Normal price : $0.10-$0.25 / load depending on bottle size
Nationally, a small fraction of households report incomes of $1 million or greater per year. But at a rate of about 3 out of 1000 households (0.28%), it is more common than you might think. There might a secret millionaire earner in your contact list.
A few states stand out nationally as having relatively percentages of these ultra earners. The coastal north eastern states earn their reputation as being abnormally wealthy. Several have rates of up to twice has high as nationally (see table):
CONNECTICUT
0.63%
DISTRICT OF
COLUMBIA
0.60%
NEW YORK
0.51%
MASSACHUSETTS
0.47%
NEW JERSEY
0.43%
While there are only 424,870 of these $1m+ households, out of a total of 149,853,100 in the country. They earn a very large share of the nations income, racking in over 13% of total income.
Income share of total income by state earned by households with $1m+ reported income to the IRS.
The list of bottom states for high earners is unsurprising with West Virginia topping that list at a rate of 7 out of 10,000. It’s not exactly a bad thing to have a low portion of ultra high earners in your state. Having a low percentage implies that there is probably a larger amount of income equity in the local economy. But since each state is part of the larger US, having a lower fraction may also imply that certain states are less desirable or economically productive compared to others.
Raw Data by State 2016
Table by State and Percentage of Tax returns that are of households >$1 million in ajusted gross income. % of Total Income is a percentage that these households earned of all the income earned in that state in 2016.
Stores plan on you not redeeming store points/dollars/rewards that they offer. So don’t let them trick you when shopping this Black Friday and Holiday season with deals that sound better than they actually are.
Every store seems to have it’s own loyalty program that has a version of points, dollars, or rewards where you pay up front for a deal and they give you back the points for your next purchase. Retailers love to do this, because they get your money up front instead of offering a more traditional discount promotion where you get the savings instantly.
How to value Retail Loyalty Points and “Dollars”
Retailers have a concept called breakage:
Breakage: Is the percentage of points earned by customers that are never redeemed.
According to the Customer Insight Group 30% of retailer points is a fairly normal number for points to go unredeemed. One way to think about it is that stores plan to never have to pay out for a large portion of the points they give out. They could offer out points with the ‘value’ of $10 but only have to plan on paying out $7.
The breakage rate varies depending on a lot of factors that I’m sure you’ve experienced when trying to use these programs:
The points will expire quickly.
They need to be spent in large amounts.
Numerous restrictions on what can be purchased.
Hard to redeem.
When you look at the value that the store tells you, think about how likely you are to actually spend it. Also remember if the store values the points at 70% of face value–or even less–you probably should too.
Examples of Egregious Point Offers
The more onerous the terms; the higher the breakage. You see offers like this Sears ‘100%’ cashback on $250, with terms like:
They’re going bankrupt so uh this is a little risky.
Points are valid for 7 days
$25 points per week for 10 weeks
Points have no cash value
Terms can change at anytime
This is one of the more obvious rip offs, but I’m sure that there are a few of you out there could make this deal work if you happen to live next to the last Sears or Kmart with the lights still on.
Their terms bring up a lot of great examples of how retailers abuse point systems. Because the retailers own the system of points, they can issue as many as they want. If they happen to over-estimate the breakage rate–meaning they made it too easy to redeem the deals– they can simply devalue their points or create new policies to increase the breakage rate. You see this a lot in programs that reduce the amount of time you have to use the points, increase restrictions, or increase redemption minimums.
Points can be worth it, but beware.
There are a lot of programs out there that are worth it, but it 100% depends on your personal habits. If it’s a store you go to frequently the loyalty programs are great ways to save and shop more. But you need to watch out the offers to stores that you rarely frequent, because those are the most likely to not pay off.
Update 1/4/2021: It still seems like they’re sending random extra items with most of my orders. It’s actually pretty rare for anything to be missing so I’m not sure if this is intentional or not? Overall it’s kind of a nice surprise and if there’s something I don’t want one of my neighbors has taken it pretty quickly. Imperfect Foods has been a good balance of value for grocery delivery compared to Instacart especially with these bonus items.
Update 8/17/2020: I’m not sure what’s going on with Imperfect Foods, but they keep sending me random items with my boxes. I keep getting what I ordered (minus things they cut from the order) plus a bunch of random things, like I don’t know how you accidentally send me my exact order plus kombucha, milk, and cheese that I didn’t order.
Update 5/9/2020: So I decided to restart using Imperfect Produce because it seemed like a nice supplement to get food delivered with the shelter in place warnings. Imperfect Produce is now called Imperfect Foods and has expanded the product lines to some dry goods (grains), dairy, meat and seafood.
In terms of cost, it looks like the box fee went away and everything is a-la carte so you don’t need to sign up for the Meat & Seafood, Grains, or Dairy packs to actually get those things. Dairy, Meat, & Seafood is shipped inside an insulated box with an ice-pack. If you’ve done Blue Apron, it’s basically the same set up. I think in terms of pricing and quality everything seems about the same as before when I wrote this article a couple years ago. In general, the pricing is fair-ish but not really cheaper when you account for the size and weight of the produce, but they are very consistent about delivering on time.
Original Review: I’ve been using Imperfect Produce which is a vegetable and fruit delivery service for the past few months. Imperfect Produce aims to reduce food waste by delivering ugly and surplus fruits and vegetables to your door. I liked the mission statement, but after a few months I felt like most of the food I was getting was labeled ‘surplus’ and prices seemed to be less competitive. Delivery to delivery, I would often buy basics like carrots and onions that were always labeled ‘surplus,’ but if they’re available all the time are they really surplus?
One of the boxes most things look pretty normal.
The fruits were kind of small
So I broke out my kitchen scale, and I tracked 4 deliveries (2 months worth!). I compared the amount that Imperfect Produce sent me and priced out the equivalent from my local grocer. Everything was compared against a direct replacement as best I could match. To keep it fair, I also included the Box Fee ($3) and Delivery Fee ($5) that Imperfect Produce charges.
Here are the cost comparisons by delivery:
Imperfect Produce
Grocery Store
Savings over Store
Box 1
$31.85
$29.90
$(1.95)
Box 2
$32.78
$28.13
$(4.65)
Box 3
$33.76
$6.57
$(7.19)
Box 4
$29.01
$26.52
$(2.49)
As you can see, Imperfect Produce has cost more than the grocery store on all of my boxes. If you subtract out the box and delivery charge the prices of the actual produce and fruits are cheaper, but once you include the total cost Imperfect Produce really isn’t a deal.
The actual produce usually looks pretty comparable to what is at the grocery store. Some of the items (especially fruit) are often smaller than at the store, but really the most obvious things are like the carrots are almost always shaped like giant turnips and the onions tend to be either gigantic or tiny. Edit 1/4/21: Fruit has consistently been small and or bruised looking. I don’t know why, but vegetables almost always are in pretty good shape but the fruit is usually not.
Items that saved the most:
Item
Imperfect Produce Cost
Store Cost
Savings
%
Conventional Green Bell Peppers (2 ct)
$0.99
$5.56
$4.6
82%
Conventional Avocados (12 ct)
$7.74
$12.20
$4.5
37%
Organic Leek (2 ct)
$4.67
$8.18
$3.5
43%
Conventional Parsnips (1.5 lb)
$0.69
$2.30
$1.6
70%
Conventional Apples (3 ct) 1lb
$1.88
$3.15
$1.3
40%
Don’t use this to save money.
If you are looking to get your vegetables delivered this is totally a viable option that doesn’t cost much more than the store. But keep in mind, you will generally end up paying more for the convenience of the having the box delivered. Selection varies week to week, so I do like using the boxes to try out different fruits and vegetables. On top of that you’ll be helping out to reduce food waste, although I’m not sure how much of those savings are offset by the delivery and non-reusable delivery box.
If you want to try out imperfect produce and live in one of the cities here’s a link for your first Imperfect Produce box. As of this post, Imperfect Produce operates in many cities including:
San Francisco Bay Area, CA
Los Angeles, CA
Orange County, CA
Portland, OR
Seattle, WA
Chicago, IL
Indianapolis, IN
Milwaukee, WI
Grocery Delivery is Now Normal!
Added 1/4/21: Well with the times as they are now, I never thought that grocery delivery would be something that would be part of my normal routine. But here we are.
Imperfect Foods has some limitations compared to other grocery delivery companies. The grains, meats, and dairy selections are pretty basic, but I can feed my household on it so it works. The brands typically are more comparable to what you would find at Whole Foods or Sprouts, so it may be a little different than what you expect from like Kroger.
Compared to Instacart, the schedules are inflexible and you have to plan your orders days in advance. But on the other hand, I do find the total delivered to the door prices pretty comparable to Instacart and Shipt. Once you add in all the extra fees for a lot of competing delivery companies (tip, delivery, bags), the all in cost of Imperfect Foods starts to look pretty competitive (no tip, delivery fees are often waived if you spend enough).
I still stand by my original assessment that compared to in-store shopping, the savings really aren’t there. But if we’re comparing like-for-like Imperfect Foods is a very compelling option that I’ve started to use more of and would recommend as long as your ok with the selection, schedule, and don’t expect to save much money.
Equifax has all of my salary history. It’s all in a 20 page packet detailing each paycheck that I’ve received since I was in college. Yes, this is the same company that got hacked and leaked practically every Social Security Number to hackers; they also have information that I only thought the IRS had.
I got curious what data Equifax keeps and ran across the Work Number. Employers–including all of my former employers–send Equifax salary history. Equifax takes this data and sells it to other companies who want to verify your income thru a service called the Work Number. You can request your own free report at the Work Number online, thru mail, or via phone. I couldn’t figure out how to use the website–not surprised that their IT infrastructure isn’t super updated. So I printed the PDF and mailed them a letter. The report arrived a couple weeks later.
What’s in a Work Number Report
The report is broken out into three parts. The first details an overview with an introduction and record of who has requested a report in the last 24 months. The second part is a record of your income history; mine was especially detailed. The third is a bunch of stuff on the terms and how to correct the records if they’re wrong.
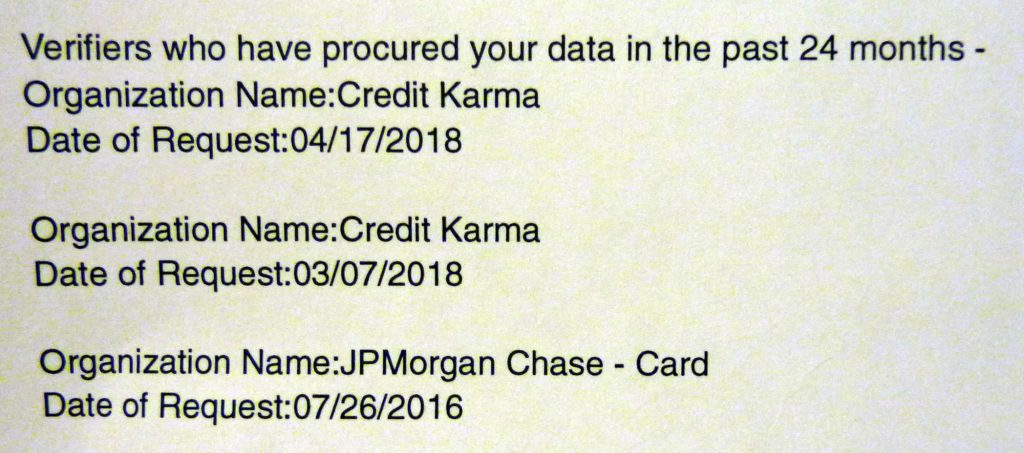
My data has been provided three times to two companies (Credit Karma and Chase) over the past 2 years. This is what is looks like:
It’s not entirely clear to me what employers or creditors can and can’t see if they request the report. I’ve never logged into the Work Number website to get a pin, but I must have clicked a button or signed off somewhere to give Credit Karma and Chase access to my data. That means whenever you agree to a background check by a potential employer, creditor, or landlord you could be also giving them permission to access your pay records that the Work Number sells.
Every pay check is listed in detail
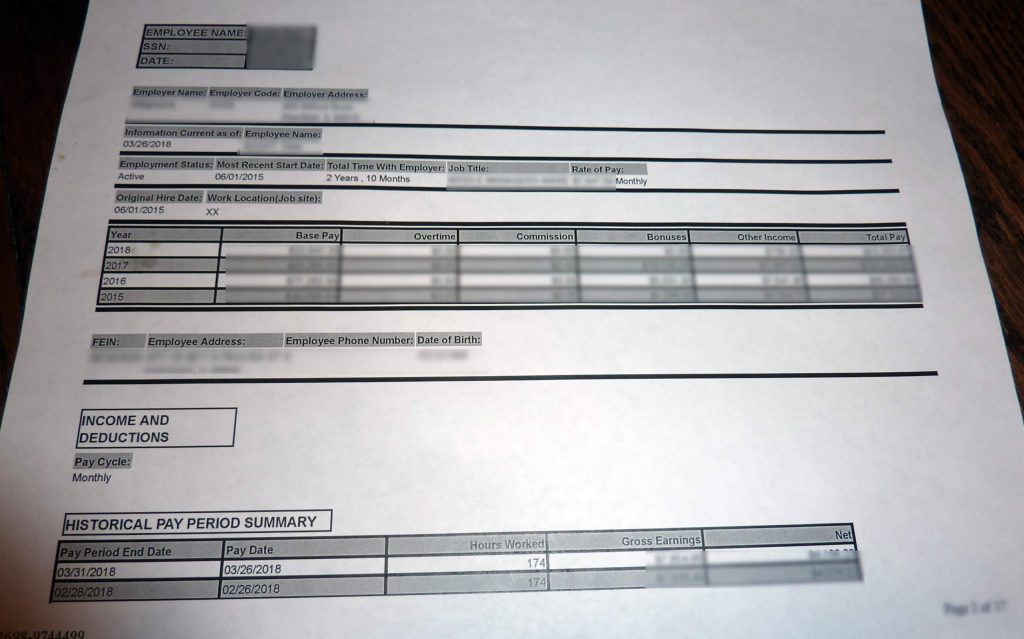
The next 17 pages were a record of my employment history. It lists a gross and net record of each and every pay stub I have ever received as an adult. The layout and information that is includes varies a little bit by employer, according to the Work Number each employer owns the data so they decide what they send. My current employer has a pretty typical layout:
At the top you have employer info, role information, start and end dates. Next is an annual summary of my income. Then comes the unexpected part of a listing of every paycheck with the net and gross income. It is 100% accurate. In fact, I think that these records are far more thorough and complete than anything I personally have been recording for the past 10 years. When I requested the report, I never expected that this level of detail was being sent to and recorded by 3rd parties.
The report just goes on and on after this. Some of my former employers reported information about insurance, specific with-holdings. Also, at least one employer only listed out my cumulative annual pay, but that was for an internship.
Be careful what you share
I see a lot of job search advice that says to fudge salary history, so that you can ensure that you get a raise for jumping ship, but keep in mind that this information is available and out there. If you lie about what your compensation was at a previous employer, you could be found out. So be careful with what you agree to, because your records are out there for companies who are willing to pay for it.
This report is 100% free, so I would definitely recommend requesting it at least once just to see what is in your file.