Most Americans say that their children will be financially worse off than they were at the same age. I decided to investigate if the trends over the past 25 years show a downward trend for today’s Millennials just now starting to 20’s and 30’s.
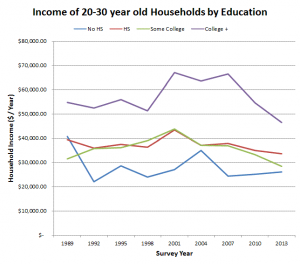
Since most of us aren’t independently wealthy enough to not work, income is the major factor behind most people’s financial health. For households who’s heads are are between the ages of 20-30 years old, inflation adjusted incomes have been trending slightly down since 1989. Since the data is grouped by the age of the head of a household, most full-time students will not be represented in this age bracket. So the trends should only include financially independent 20-30 year olds who have left their parents households. In the graph you can see that the educational income premium for 20-30 years is very significant. Fluctuating at a roughly 40% increase for college graduates over high school graduates.
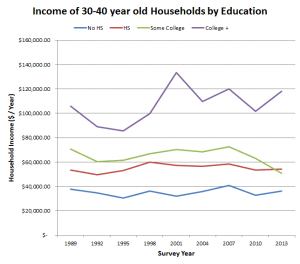
The inflation adjusted incomes of the older millenial and the younger Gen-Xers (represented in the 30-40s age groups in the 2013 data) also follow a similar trend of staying relatively stable since 1989. College graduates have seen a slight over-all increase but not much. So it looks like at least looking at just income, Millenials and young Gen-Xers are doing roughly the same as the the previous generations in terms of income.
So far, we’ve seen that things are not bad for college graduates, not great but at least for the most part today’s Millennials are starting off at roughly the same incomes as the previous generations. The other educational income groups aren’t doing quite as well as college graduates, but their overall trends are not quite as terrible as headlines would suggest.
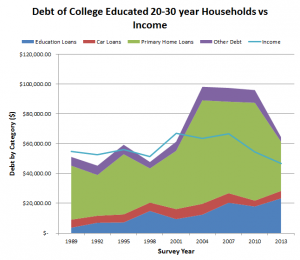
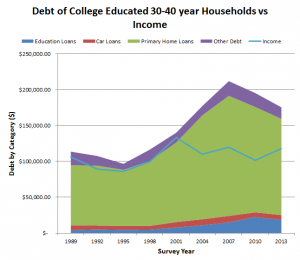
Income isn’t the only measure of financial health though. Debt is another important factor and as the graphs show, debt is increasing significantly for college graduates. Debt from housing (such as mortgages) has been the category with the largest dollar value increase over the past 2 decades. There was a spike in debt leading up to the great recession that appears to have followed the 30-40 year old households as they have aged. For the 20-30s bracket is seems as though enthusasim over home ownership has reverted back to the historical levels of debt despite the current low interest rates. Car loans have also been largely stable and are almost unchanged, since 1989. The biggest consistent percent increase has been in student loans which comprise roughly a third of 20-30 year old debts and about a tenth of 30-40 year old debts in 2013.

OOverall from these selected figures, younger Millennials are not doing worse than previous generations, but older Millennials are carrying far greater loads of debt that any comparable age group before.
These figures are results off of the Survey of Consumer Finances conducted by the US Federal Reserve. All figures are stated in 2013 inflation adjusted dollars.

