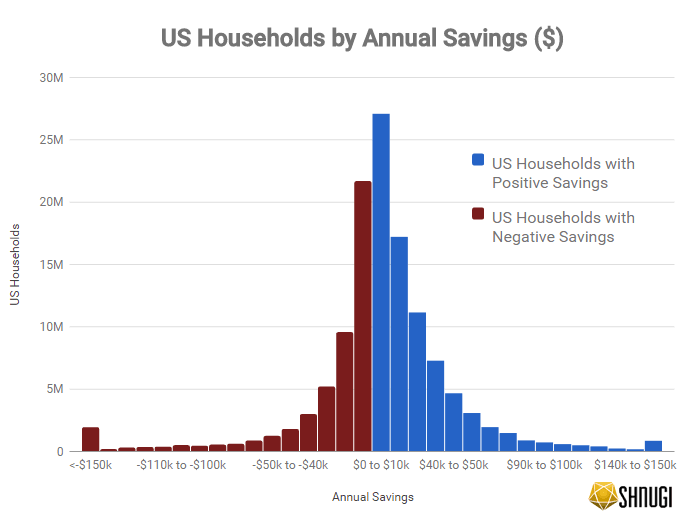
According to data from the 2015 Consumer Expenditures Survey by the Bureau of Labor Statistics, nearly 38.5% of US households spent more than they earned. Overall, 49.4 million out of 128 million US households are estimated to have had expenditures that exceeded their after tax income (table below). Another 21.1% (27.1 million) of US households saved less than $10,000 per year. One interesting fact is that 8.9% (11.3 million) US households are able to save at least $50,000 per year which is roughly equal to the median US household income.
Hover or click on the graph for more information.
The original Consumer Expenditures Survey considers retirement contributions as an expense, and even with adjusting those into savings 37.5% of households still spent more than they earned. Recently, there have been many studies reiterating the lack of savings that Americans have on had for emergencies. This data aligns with those earlier views on the poor health of the average American’s finances.
Source Data and Methodology
These results are calculated using the 2015 Bureau of Labor Statistics (BLS) Consumer Expenditures Survey (CEX) microdata. The microdata has survey results for a sample of 30,000 US households which are used to estimate the spending and income of the total US population. The data is weighted on a variety of factors by the Bureau of Labor Statistics so that the households sampled model reality. I used the pre-built SAS macro for the 2015 data to merge the interview with the diary files and aggregate expenditures by survey household unit. The interview and diary don’t link on a 1:1 ratio, so I allocated the diary expenditures across each survey household in the interview files. Each survey household was allocated a variable amount from the diary expenditures based on the household unit’s income, expenditures reported in the interview files, and population weight. I also took steps to ensure that the rolled up results still matched the published statistics on the BLS.
Annual Savings Amounts Table
Households Unadjusted : 38.5% of US households spent more than they earned in 2015. This was calculated using the CEX total annual expenditure by household. The CEX lumps all retirement contributions (401k, pensions, TSP) into expenditures. Household annual savings calculated as : [Estimated Pre-Tax Income] – [Estimated Taxes] – [Estimated Expenditures]
Households Adjusted : Adjusted for retirement contributions, 37.5% spent more than they earned in 2015. This was calculated using CEX total annual expenditure minus household retirement contributions by household. Social Security is still included in the expenditure values. Household annual savings calculated as : [Estimated Pre-Tax Income] – [Estimated Taxes] – [Total Estimated Expenditures] + [Total Estimated Retirement Contributions].
| Annual Savings |
Households (unadjusted) |
Households (adjusted) |
| <-$150k |
1,994,856 |
1,867,628 |
| -$150k to -$140k |
232,678 |
242,359 |
| -$140k to -$130k |
355,854 |
303,275 |
| -$130k to -$120k |
405,725 |
363,365 |
| -$120k to -$110k |
429,066 |
411,577 |
| -$110k to -$10k0 |
553,061 |
513,501 |
| -$10k0 to -$90k |
508,511 |
477,909 |
| -$90k to -$80k |
593,815 |
581,473 |
| -$80k to -$70k |
662,847 |
646,504 |
| -$70k to -$60k |
919,974 |
932,389 |
| -$60k to -$50k |
1,294,006 |
1,215,488 |
| -$50k to -$40k |
1,851,218 |
1,833,831 |
| -$40k to -$30k |
3,044,652 |
2,888,244 |
| -$30k to -$20k |
5,260,480 |
5,229,834 |
| -$20k to -$10k |
9,618,222 |
9,421,512 |
| -$10k to $0 |
21,733,884 |
21,187,798 |
| $0-$10k |
27,128,611 |
26,860,088 |
| $10k to $20k |
17,256,672 |
17,137,557 |
| $20k to $30k |
11,193,070 |
11,312,717 |
| $30k to $40k |
7,325,112 |
7,590,525 |
| $40k to $50k |
4,709,618 |
4,965,180 |
| $50k to $60k |
3,124,669 |
3,342,971 |
| $60k to $70k |
1,994,672 |
2,250,973 |
| $70k to $80k |
1,521,623 |
1,584,928 |
| $80k to $90k |
929,844 |
1,064,559 |
| $90k to $100k |
770,054 |
830,612 |
| $100k-$110k |
632,352 |
659,814 |
| $110k to $120k |
542,022 |
618,322 |
| $120k to $130k |
450,592 |
484,008 |
| $130k to $140k |
278,440 |
347,594 |
| $140k to $150k |
219,223 |
217,597 |
| >$150k |
901,936 |
1,053,230 |
If the interactive chart didn’t load for you, here is an image of the chart.
Related Topics
Savings Rate Ranking : This uses the adjusted savings rate calulation listed above to compare savings as a percentage of income.
Net Worth Rank by Age : This uses Survey of Consumer Finances data to calculate the net worth percentile rank depending on the age of the head of household.
Income Rank by Age : This uses Survey of Consumer Finances data to calculate the income percentile rank depending on the age of the head of household.
Last updated:Thursday, February 2, 2023


