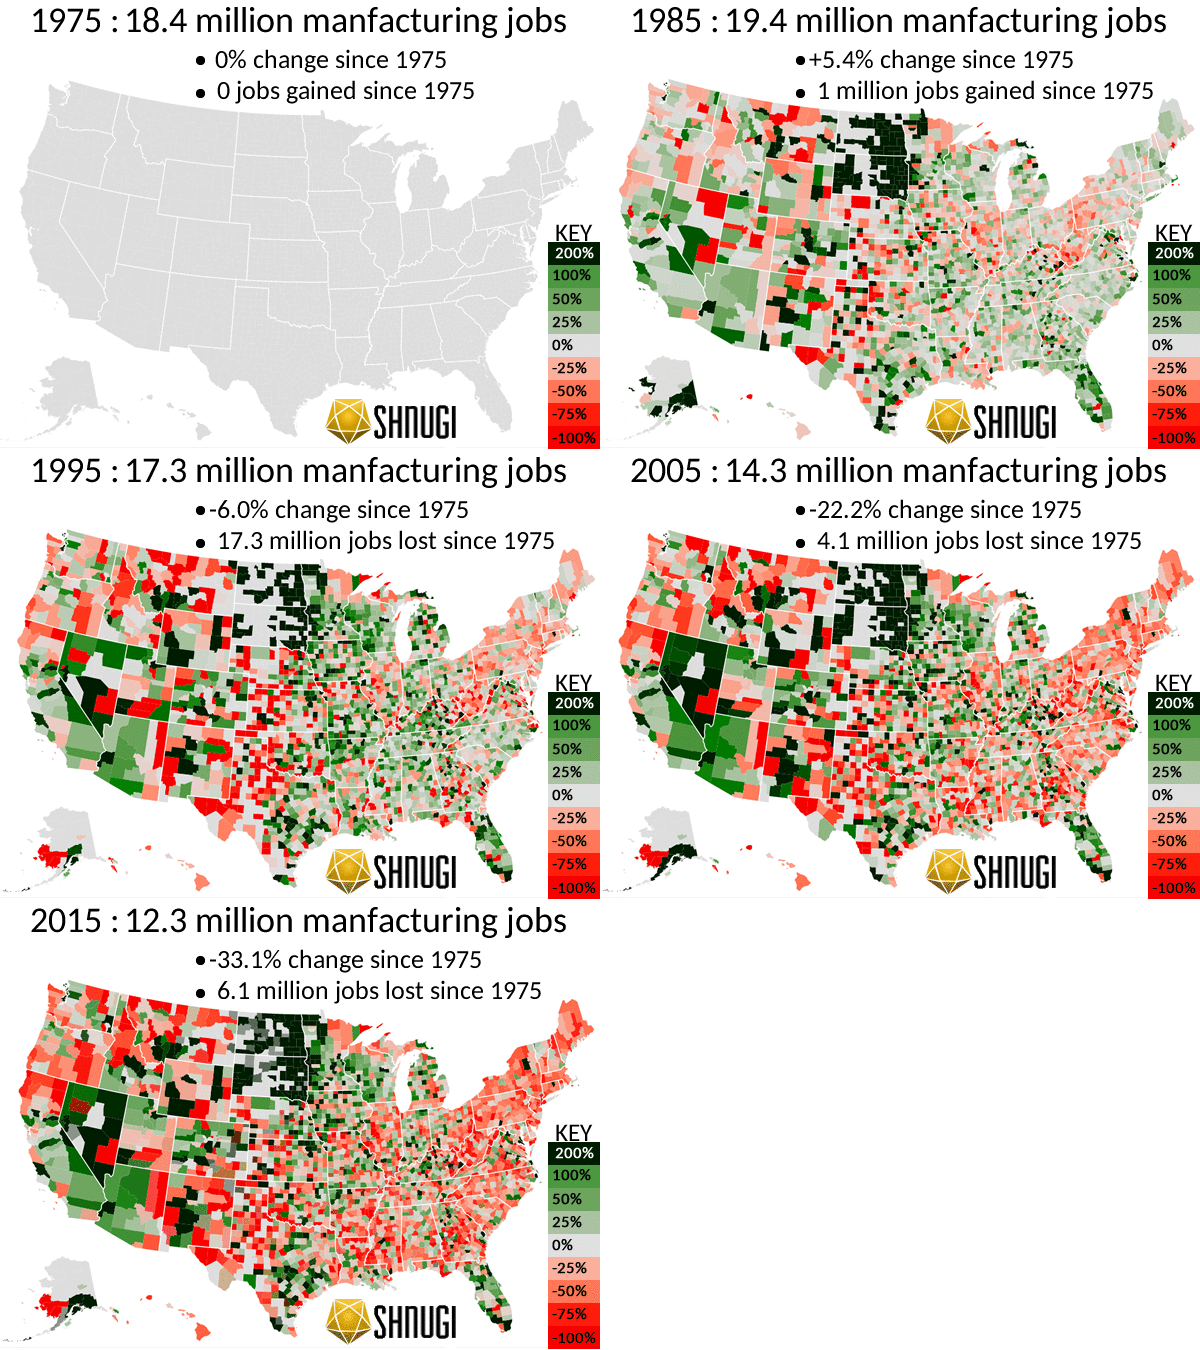
Watch 40 years of change in manufacturing jobs across the United States from 1975 to 2015. The colors are based on the number of manufacturing jobs in each county as measured by the Bureau of Labor Statistic’s Labor Estimates. Each year (1985, 1995, 2005, and 2015) are compared to 1975 to calculate the percentage change. Green counties have gains in manufacturing jobs. Red counties have losses. Counties that are gray have little to no change.
Overall, these 15 counties have seen the largest losses. Most of these counties were former industrial powerhouses who had distinct advantages in transportation, infrastructure, and energy availability. Those advantages have been rendered obsolete. Rapid automation and infrastructure improvements in transportation, energy, and communications across the rest of nation have enabled production to spread across the United States as well as overseas.
Top 15 Counties by Largest Losses in Manufacturing Jobs
| County | 2015 | 1975 | Net Loss |
|---|---|---|---|
| Cook County, Illinois | 186,967 | 666,136 | -479,169 |
| Los Angeles County, California | 357,554 | 777,465 | -419,911 |
| New York County, New York | 27,098 | 293,745 | -266,647 |
| Wayne County, Michigan | 88,578 | 325,077 | -236,499 |
| Cuyahoga County, Ohio | 69,812 | 224,160 | -154,348 |
| Philadelphia County, Pennsylvania | 21,473 | 164,885 | -143,412 |
| Allegheny County, Pennsylvania | 36,150 | 159,353 | -123,203 |
| Milwaukee County, Wisconsin | 52,495 | 154,937 | -102,442 |
| Kings County, New York | 21,174 | 119,640 | -98,466 |
| Hamilton County, Ohio | 48,357 | 134,527 | -86,170 |
| Monroe County, New York | 40,872 | 125,510 | -84,638 |
| St. Louis City Missouri | 17,871 | 194,998 | -77,127 |
| Fairfield County, Connecticut | 33,938 | 108,405 | -74,467 |
| Bergen County, New Jersey | 30,947 | 103,631 | -72,684 |
| Essex County, New Jersey | 16,990 | 89,462 | -72,472 |
Almost all of these counties are located in the Rust Belt with the exclusion of Los Angeles, County. Although many of these counties have successfully shifted to new industries in tech and finance, others such as Wayne County have been struggling.
On the other side, counties which have seen the largest increases have not seen increases as large as the decreases in the top 15 counties. Cook County alone had 666k manufacturing jobs in 1975 compared to these counties which had 927k manufacturing job combined in 2015.
Top 15 Counties by Largest Gains in Manufacturing Jobs
| County | 2015 | 1975 | Net Change |
|---|---|---|---|
| Maricopa County, Arizona | 115,385 | 71,973 | 43,412 |
| Snohomish County, Washington | 63,537 | 20,588 | 42,949 |
| San Diego County, California | 104,092 | 71,087 | 33,005 |
| Elkhart County, Indiana | 60,478 | 31,269 | 29,209 |
| Harris County, Texas | 189,946 | 161,511 | 28,435 |
| Washington County, Oregon | 47,167 | 19,747 | 27,420 |
| Travis County, Texas | 40,252 | 14,568 | 25,684 |
| Riverside County, California | 41,210 | 18,907 | 22,303 |
| Ottawa County, Michigan | 38,358 | 17,732 | 20,626 |
| San Bernardino County, California | 53,485 | 32,871 | 20,614 |
| Collin County, Texas | 23,618 | 3,705 | 19,913 |
| Rutherford County, Tennessee | 25,301 | 5,989 | 19,312 |
| Waukesha County, Wisconsin | 43,850 | 24,896 | 18,954 |
| Gwinnett County, Georgia | 25,246 | 6,328 | 18,918 |
| DuPage County, Illinois | 55,273 | 36,416 | 18,857 |
Note: Some counties have been excluded from the summary tables due to missing data on some of the reported years.
