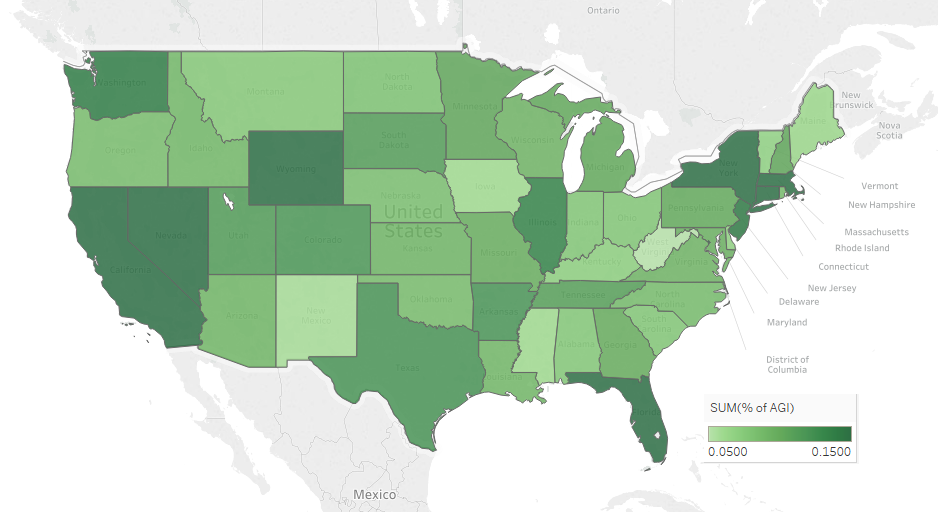
Nationally, a small fraction of households report incomes of $1 million or greater per year. But at a rate of about 3 out of 1000 households (0.28%), it is more common than you might think. There might a secret millionaire earner in your contact list.
A few states stand out nationally as having relatively percentages of these ultra earners. The coastal north eastern states earn their reputation as being abnormally wealthy. Several have rates of up to twice has high as nationally (see table):
| CONNECTICUT | 0.63% |
| DISTRICT OF COLUMBIA | 0.60% |
| NEW YORK | 0.51% |
| MASSACHUSETTS | 0.47% |
| NEW JERSEY | 0.43% |
While there are only 424,870 of these $1m+ households, out of a total of 149,853,100 in the country. They earn a very large share of the nations income, racking in over 13% of total income.

The list of bottom states for high earners is unsurprising with West Virginia topping that list at a rate of 7 out of 10,000. It’s not exactly a bad thing to have a low portion of ultra high earners in your state. Having a low percentage implies that there is probably a larger amount of income equity in the local economy. But since each state is part of the larger US, having a lower fraction may also imply that certain states are less desirable or economically productive compared to others.
Raw Data by State 2016
Table by State and Percentage of Tax returns that are of households >$1 million in ajusted gross income. % of Total Income is a percentage that these households earned of all the income earned in that state in 2016.
| State | % of Returns | % of Total Income | Total Returns |
| UNITED STATES | 0.28% | 13.34% | 424,870 |
| ALABAMA | 0.16% | 7.63% | 3,240 |
| ALASKA | 0.19% | 5.96% | 660 |
| ARIZONA | 0.20% | 9.02% | 5,830 |
| ARKANSAS | 0.14% | 11.94% | 1,760 |
| CALIFORNIA | 0.40% | 17.73% | 71,290 |
| COLORADO | 0.29% | 11.79% | 7,660 |
| CONNECTICUT | 0.63% | 22.19% | 10,990 |
| DELAWARE | 0.19% | 6.73% | 850 |
| DISTRICT OF COLUMBIA | 0.60% | 18.57% | 2,070 |
| FLORIDA | 0.29% | 16.71% | 28,420 |
| GEORGIA | 0.23% | 9.87% | 10,050 |
| HAWAII | 0.15% | 6.75% | 1,010 |
| IDAHO | 0.16% | 8.92% | 1,220 |
| ILLINOIS | 0.31% | 13.40% | 19,180 |
| INDIANA | 0.16% | 7.74% | 4,870 |
| IOWA | 0.15% | 5.95% | 2,100 |
| KANSAS | 0.20% | 9.10% | 2,610 |
| KENTUCKY | 0.13% | 7.05% | 2,550 |
| LOUISIANA | 0.19% | 8.99% | 3,830 |
| MAINE | 0.14% | 6.20% | 940 |
| MARYLAND | 0.28% | 9.54% | 8,170 |
| MASSACHUSETTS | 0.47% | 17.77% | 16,160 |
| MICHIGAN | 0.19% | 10.15% | 9,190 |
| MINNESOTA | 0.25% | 10.36% | 6,970 |
| MISSISSIPPI | 0.11% | 5.93% | 1,340 |
| MISSOURI | 0.19% | 9.77% | 5,240 |
| MONTANA | 0.15% | 7.46% | 750 |
| NEBRASKA | 0.18% | 8.35% | 1,650 |
| NEVADA | 0.27% | 20.14% | 3,770 |
| NEW HAMPSHIRE | 0.23% | 10.37% | 1,590 |
| NEW JERSEY | 0.43% | 14.23% | 19,070 |
| NEW MEXICO | 0.11% | 5.68% | 990 |
| NEW YORK | 0.51% | 23.37% | 48,570 |
| NORTH CAROLINA | 0.19% | 8.60% | 8,660 |
| NORTH DAKOTA | 0.19% | 8.01% | 700 |
| OHIO | 0.17% | 7.69% | 9,560 |
| OKLAHOMA | 0.17% | 8.54% | 2,760 |
| OREGON | 0.20% | 8.47% | 3,790 |
| PENNSYLVANIA | 0.22% | 10.13% | 13,860 |
| RHODE ISLAND | 0.19% | 8.57% | 1,020 |
| SOUTH CAROLINA | 0.18% | 7.77% | 3,880 |
| SOUTH DAKOTA | 0.22% | 11.19% | 920 |
| TENNESSEE | 0.21% | 11.01% | 6,160 |
| TEXAS | 0.26% | 12.07% | 31,810 |
| UTAH | 0.23% | 11.37% | 2,970 |
| VERMONT | 0.16% | 6.86% | 520 |
| VIRGINIA | 0.26% | 9.19% | 10,010 |
| WASHINGTON | 0.30% | 13.88% | 10,600 |
| WEST VIRGINIA | 0.07% | 3.23% | 550 |
| WISCONSIN | 0.19% | 9.18% | 5,460 |
| WYOMING | 0.29% | 18.57% | 770 |
| OTHER AREAS [20] | 0.82% | 40.61% | 6,300 |
Sources
The source of these data tables comes from the Excel files available freely on the IRS website. The figures above are from 2016. https://www.irs.gov/statistics/soi-tax-stats-historic-table-2
