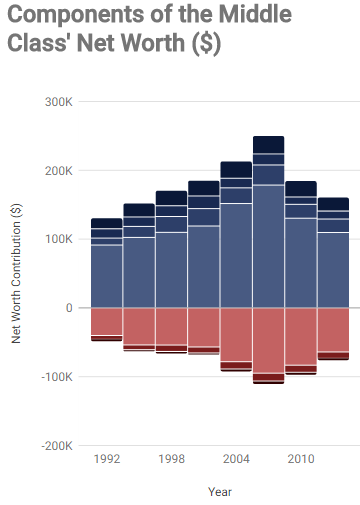
One recurring request for the net worth percentile calculator on this website to show a break down of what makes up that net worth value. Here it is for a typical middle class household!
Here are the results of that request for a typical middle class household with comparisons for the past 20 years. The overall trend for the shows that net worth has increased slightly, but assets and debts have also increased at almost the same rate.
Housing is by far the largest contributor to middle class wealth with investments contributing a far lower amount. In 2013, real estate contributed 54% of net worth ($110k in real estate assets – $64k in real estate related loans).
Net worth peaked in 2007 prior to the recession, and as of 2013 has not recovered yet. The 2016 data should be available over the summer in a few months, so we’ll see if the downward trend continues.
Net Worth Component Definitions
- Real Estate : House(s) and other real estate
- Investments : Retirement funds, stocks, mutual funds, stock options
- Low Risk Investments : Cash, bonds, CD’s, and cash value of life insurance
- Other Assets : Cars and other assets
- Real Estate Debt : Mortgages and other real estate related loans
- Student Loans and Auto Loans : These were already combined in the source data as installment loans.
- Credit Cards and Other Debt : Credit cards and other debt
The data is sourced from the Federal Reserve and all values are adjusted for inflation to 2013 dollars. The 2016 data will be published over the summer and I am planning to update the calculators and this chart to show additional trends.
We used the data for the 40-60th percentiles to create a weighted average net worth of what makes up the wealth of an average household, and to represent the middle class. Because it is a weighted average (mean), the net worth values are skewed slightly higher than a median based calculation.
Summary Table of Net Worth for the Middle Class
Note: these values are adjusted for inflation into 2013 dollars.
| Year | Total Assets | Total Debt | Median Net Worth |
| 1992 | $131,000 | ($48,603) | $82,397 |
| 1995 | $152,434 | ($63,897) | $88,537 |
| 1998 | $171,146 | ($67,091) | $104,054 |
| 2001 | $185,715 | ($68,590) | $117,125 |
| 2004 | $213,655 | ($93,009) | $120,646 |
| 2007 | $250,588 | ($111,403) | $139,185 |
| 2010 | $185,185 | ($97,994) | $87,191 |
| 2013 | $161,126 | ($76,052) | $85,074 |
If the graph doesn’t load here is an image:


The recession did hit people from all over the world. In my country many are still struggling to get back on track after a disastrous period in 2009-2010. The main issue is that the economy doesn’t seem to do too well now either, so it’s gonna be interesting to watch what happens next.