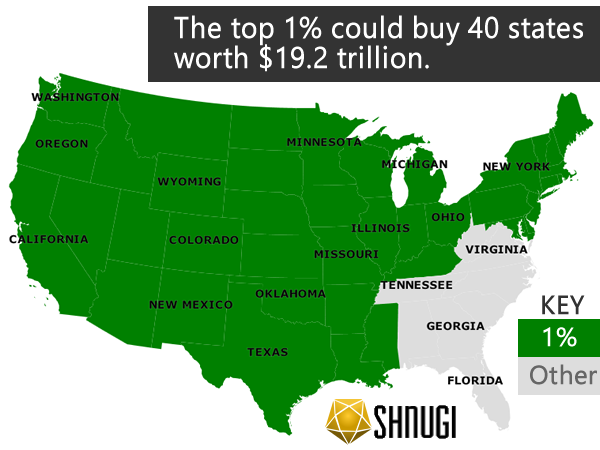
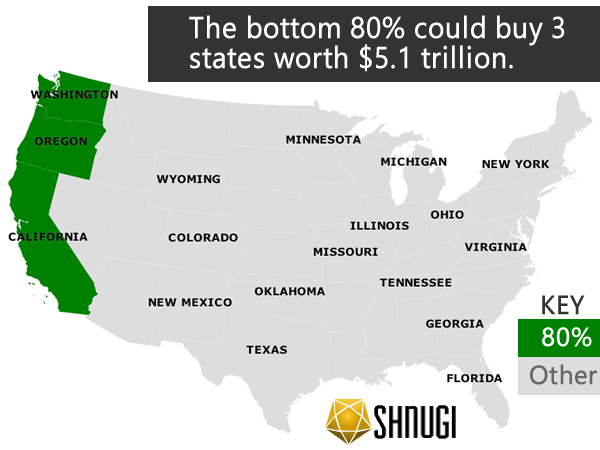
If the top 1% of the nation put all of their money into land they would own 40 states. In contrast the bottom 80% of the nation could only afford to own all the real estate in 3 states. All the real estate in the contiguous US is estimated to be worth nearly $23 trillion. The top 1% of US households is estimated to be worth $19.2 trillion. This means that only 1% of the US population could literally afford to buy almost the entire country if it were for sale.

These numbers are based on the top 1% by net worth, instead of income. Sources and tables are at the bottom of the page. If you’re curious how close you are to the top 1%, try out the net worth percentile calculator or the income percentile calculator. They are based on a different data set, but the general trends are the same.
I filled in the maps starting in the west coast and moved east. I removed states that the 1% couldn’t afford in their $19.2 trillion budget starting with Florida. The 8 states in the contiguous US that weren’t selected are Tennessee, West Virginia, Virginia, North Carolina, South Carolina, Georgia, Alabama, and Florida.

The bottom 80% had a combined wealth of $5.1 trillion, which could pay for California, Oregon, and Washington. I wanted to stay consistent and start from the west coast, so California just based on it’s size and wealth is driving down the number of states.
This is how much land the top 1% could own if all their money was in property
- Net Worth of the Top 1% ($19.1 trillion)
- Net Worth of the Bottom 80% ($5.1 trillion)
Table of State Real Estate Values
| State | Real Estate Values ($ billions) |
| Alabama | 400 |
| Arizona | 315 |
| Arkansas | 224 |
| California | 3905 |
| Colorado | 429 |
| Connecticut | 400 |
| Delaware | 72 |
| Dist. Of Columbia | 42 |
| Florida | 1021 |
| Georgia | 528 |
| Idaho | 182 |
| Illinois | 833 |
| Indiana | 387 |
| Iowa | 235 |
| Kansas | 220 |
| Kentucky | 183 |
| Louisiana | 354 |
| Maine | 122 |
| Maryland | 470 |
| Massachusetts | 517 |
| Michigan | 865 |
| Minnesota | 416 |
| Mississippi | 166 |
| Missouri | 318 |
| Montana | 213 |
| Nebraska | 144 |
| Nevada | 149 |
| New Hampshire | 114 |
| New Jersey | 930 |
| New Mexico | 150 |
| New York | 1245 |
| North Carolina | 506 |
| North Dakota | 110 |
| Ohio | 838 |
| Oklahoma | 323 |
| Oregon | 400 |
| Pennsylvania | 914 |
| Rhode Island | 90 |
| South Carolina | 339 |
| South Dakota | 103 |
| Tennessee | 380 |
| Texas | 1266 |
| Utah | 247 |
| Vermont | 44 |
| Virginia | 555 |
| Washington | 716 |
| West Virginia | 162 |
| Wisconsin | 344 |
| Wyoming | 97 |
Source : New Estimates of Value of Land of the United States (published 2015, 2009 data)
Wealth by Percentile
I thought about using the SCF data that I already include on the calculators pages, but I decided to do some additional third party referencing instead.
| Group | Total Wealth ($ trillions) | Mean Household Wealth ($ millions) | Households (millions) |
| Top 1% | $19.18 | $16.44 | 1.167 |
| Next 19% | $45.71 | $2.06 | 22.173 |
| 60-80% | $5.06 | $0.22 | 23.34 |
| 40-60% | $1.42 | $0.06 | 23.34 |
| Bottom 40% | -$0.49 | -$0.01 | 46.68 |
Wealth Sources : Wealth Power and Income (2010 values)
Household data from the US Census 2010
