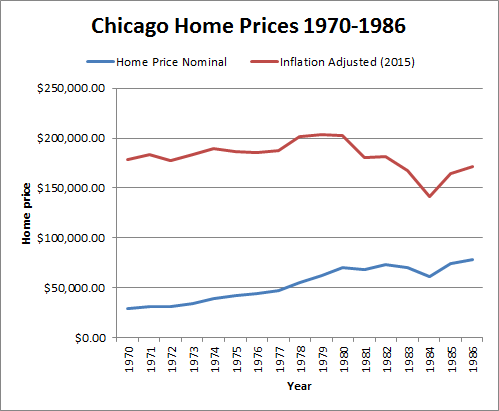
I was recently exploring some of Robert Shiller’s online data and noticed that he had some historical housing data on Chicago from the 1970s and 1980s. I was curious what the data looked like after adjusting it for inflation and comparing it to more recent housing prices. Conventional wisdom says that home ownership is one of the best investments that can be made. This is because it is an investment that you can use on a daily basis on top of being an asset that could potentially appreciate in value over time.
After adjusting the historical median home prices, median single family home prices were generally between $170,000-200,000 for the 16 year period that Shiller researched (see table below). According the Chicago Tribune, in early 2016, Chicago single family home prices were roughly $223,000. Taking the inflation adjusted numbers compared to the current housing values, this equals a 0.5% to 1.0% annual inflation adjusted growth rate to property values of single family homes in the city of Chicago, which is in line with previous estimates of home appreciation in the US.
As you can see in the table of the results, the nominal home prices have increased greatly over the past few decades, but the rate of growth over inflation is much smaller than you would have thought given conventional wisdom.
| Year | Home Price Nominal | Inflation Adjusted (2015) | Inflation Adjusted Growth Rate |
|---|---|---|---|
| 1970 | $29,000.00 | $178,930.00 | 0.489% |
| 1971 | $31,000.00 | $183,210.00 | 0.447% |
| 1972 | $31,000.00 | $177,320.00 | 0.533% |
| 1973 | $34,000.00 | $183,260.00 | 0.467% |
| 1974 | $39,000.00 | $189,540.00 | 0.397% |
| 1975 | $42,000.00 | $186,900.00 | 0.441% |
| 1976 | $44,000.00 | $185,240.00 | 0.476% |
| 1977 | $47,500.00 | $187,625.00 | 0.455% |
| 1978 | $55,000.00 | $201,850.00 | 0.269% |
| 1979 | $62,000.00 | $203,980.00 | 0.248% |
| 1980 | $70,000.00 | $203,000.00 | 0.268% |
| 1981 | $68,500.00 | $180,155.00 | 0.628% |
| 1982 | $73,000.00 | $181,040.00 | 0.632% |
| 1983 | $69,900.00 | $167,760.00 | 0.889% |
| 1984 | $61,500.00 | $141,450.00 | 1.468% |
| 1985 | $74,000.00 | $164,280.00 | 1.019% |
| 1986 | $78,500.00 | $171,130.00 | 0.913% |

The raw housing data is available on Shiller’s website, and data for Dallas and Atlanta are also available. The inflation data is from Westegg.
