Update: December 2019 Net Worth = $450k
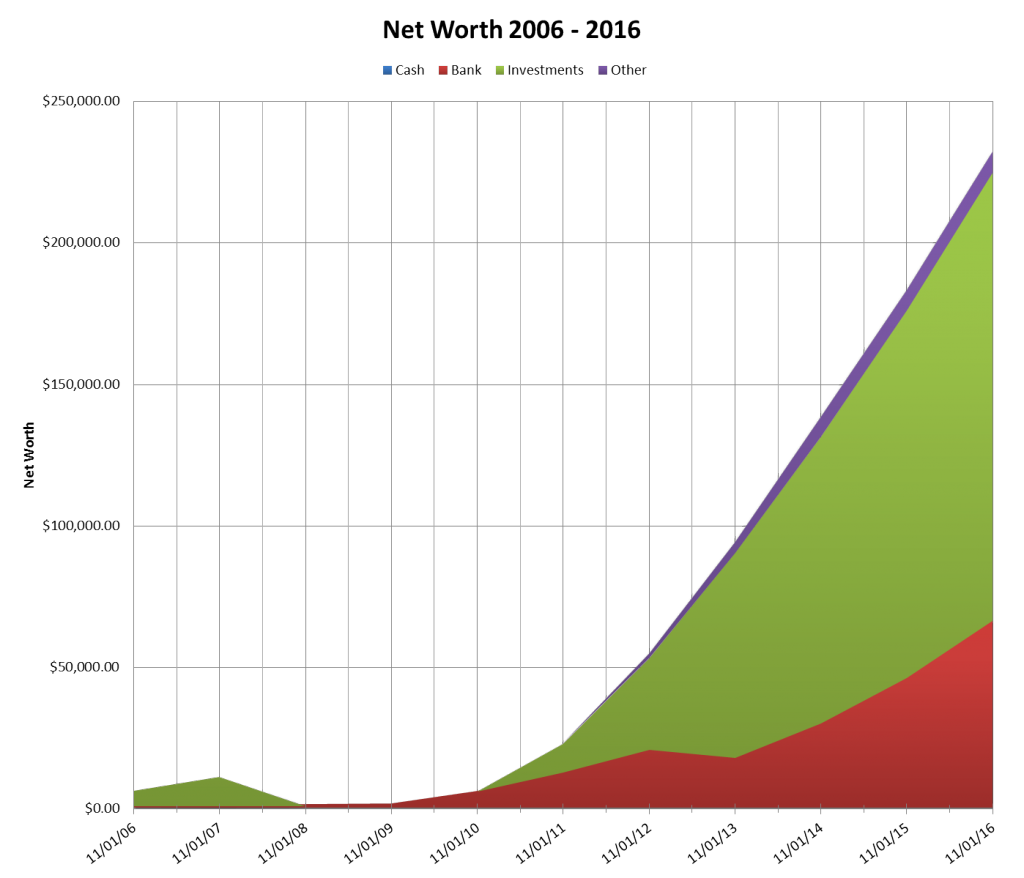
Update: November 2016 Net Worth = $232,217
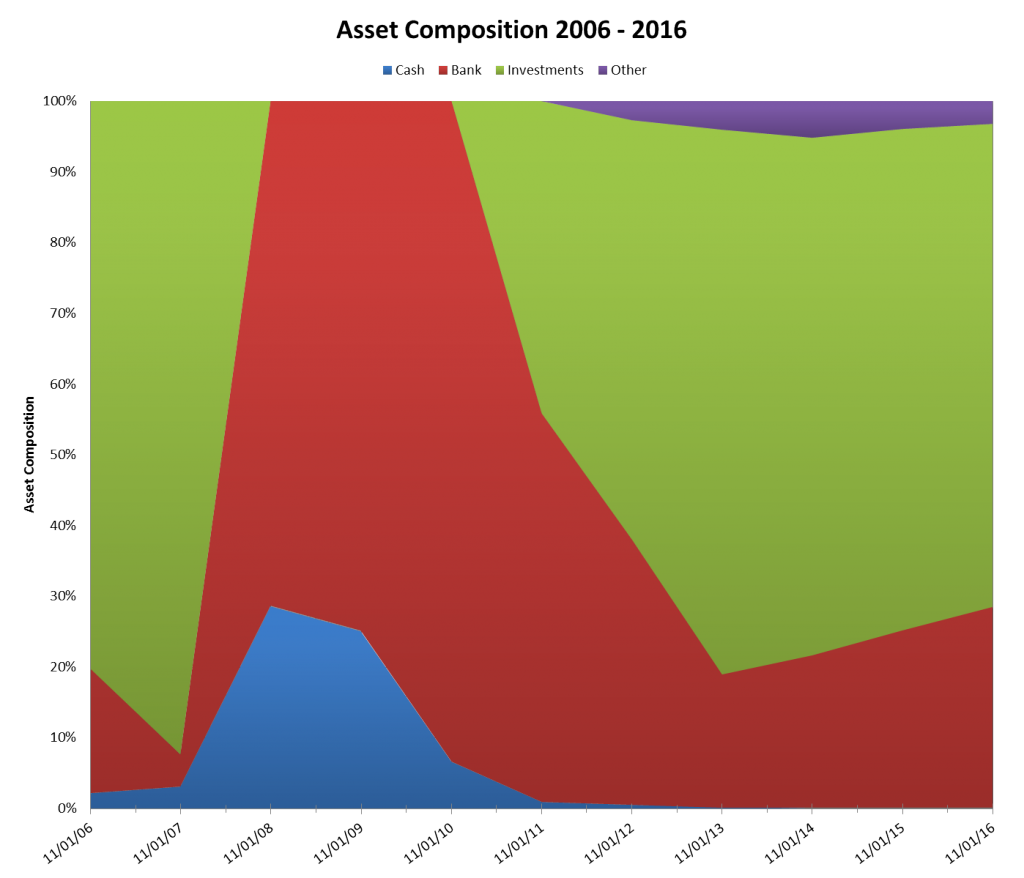
- 28.7% Liquid (Banks, Cash, CDs)
- 68.3% Investments (401k, Roth IRA, Taxable Accounts)
- 3% Other (HSA, gift cards)
What’s changed over the past year?
I’ve gotten a raise and a promotion, so my income is up. You can’t really tell in the overall graph, but I’ve had some stock losses and a lot of my investments have been pretty stagnant over the year. My annual contributions to my Roth IRA and 401k swamp out the losses, so everything looks great even though the money that I’ve built up over the past 10 years didn’t really grow.
Net Worth Tracking for the Past 10 Years
I started tracking my finances shortly after I got my first job, so I’ve got quite a bit of history in these graphs. All the newer numbers were saved into Mint, while the pre-2009 numbers are primarily from a messy spreadsheet that I’ve been keeping forever. As you can see all of my asset classes have been increasing steadily over the past 6 years.
I know I’m carrying a lot of liquid assets in my banking category. I’ve been thinking about buying a house, so I’m keeping my options open for the moment. I already have quite a bit more in investments than is typical for my age, so I’m not really too bothered by having too much cash for now.
The other bucket is mostly my HSA and a few random assets like gift cards that have well defined values. I’m not including any other physical assets, since those are hard to value without inflating these numbers.
Here’s a break-down of my asset composition over time. The percentage that is cash has been rising substantially as I’m not sure what the best use of it is–first world problem, I know. I could put it into investing, buy a business, or buy a house or something. There are a lot of options out there, and I’m really not sure at this point what I want to commit to.
Read about calculating your net worth.


