With all the recent discussion on fake news. I want to take some time to go over some basic fact checking. Recently, it came to my attention that a certain website was publishing a number that said the average millennial had a negative net worth–this is false by the way. The author crudely extrapolated off of a handful of data points from the SCF and a WSJ article.
My Net Worth Percentile Calculator as well as the others all run off of the publicly available micro-data from the Federal Reserve’s Survey of Consumer Finances or Bureau of Labor Statistic’s Consumer Expenditure. I take great care to ensure that the results of the calculators would meet the same standards as the work I do in my day job as an analyst.
Comparison to Published SCF Stats
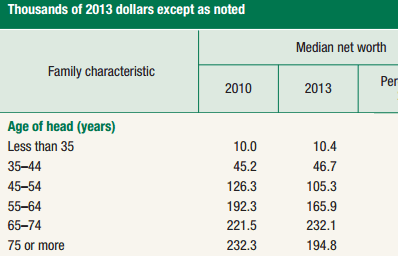
Here, are side by side comparisons from the Survey of Consumer Finances. I am using this Changes in U.S. Family Finances from 2010 to 2013: Evidence from the Survey of Consumer Finances to do the comparisons.
On page 12 these are the value’s calculated for median net worth by age from the SCF:
Click on the links to open the net worth percentile calculator for that age range.
| Age | Median Net Worth 2013 |
| Less than 35 | $ 10,460 |
| 35-44 | $ 47,050 |
| 45-54 | $ 105,600 |
| 55-64 | $ 169,640 |
| 65-74 | $ 229,800 |
| Greater than 75 | $ 194,700 |
As you can see, the totals from the calculator track very closely with the published statistics from the US Treasury. The numbers do not match exactly, probably due to some differences in clean up that the US Treasury does for their official numbers versus what I do with the the raw data that they publish.

Thanks for putting in the hard work to do this stuff right 🙂 wish there were more people like you!
I have enjoyed your calculator. It is easy to find income data on the web, but this is my source for net worth data. Hope you will be able to update the data to a more recent year than 2013.
Hello,
What percentage of the population makes the top 5% of usual income?
What percentage of the population makes to top 5% of the median wealth?